Home » Disaster Risk Management
Category Archives: Disaster Risk Management
There are no Black Swans

One of the things that irritate me most about the Black Swan discussion is the number of people, workshops, media articles etc. that talk about trying to find them.*
A Black Swan is by definition something you did not expect to occur. It’s something you’re not prepared for (specifically), something that took you by surprise. Once you’ve forecast an event (or at least entertained its possibility) it ceases to be a Black Swan.
But are Black Swans really a complete surprise?
Someone, somewhere may have thought of the possibility of any event. When you think about it, all events are really Gray Swans or Gray Geese (I like the alliteration better). Indeed the events usually trotted out as Black Swans (9/11, the GFC, the Tohoku earthquake and Fukushima disaster) had been entertained as possibilities by smart people working in relevant fields. Indeed proposals had been made for various actions that would have prevented or substantially mitigated these disasters. But the decision makers, the people who really count, did nothing. They either weren’t told about the risk or chose to do nothing.
However, just because these events can be foreseen doesn’t mean we need to be expending enormous effort in searching for them.
One of the problems with the ‘hunting black swans’ mentality is that there are a near infinite number of possible events, of which only a much smaller subset will actually occur in a reasonable planning horizon. Trying to address every Gray Goose you can think of will quickly get you nowhere. What’s needed are actions that will enable organisations and communities to adapt to any event – this is what much of the resilience discussion is getting at.
Yet some of the risks we face are worth addressing on their own, either because they’re very likely or easy to mitigate – the ‘low hanging fruit’ of the risk management world. We shouldn’t ignore these in our quest for resilience, yet these ‘easy’ risks are sometimes forgotten about in the resilience discussion.
The risk landscape is not static either. Some risks that were Gray Geese may become easier to mitigate or likely enough that they warrant individual attention. Others may diminish in likelihood or become harder to mitigate individually and so are better off treated as part of broader resilience processes.
That might be harder than running workshops around finding black swans, but it will be much more useful.
*I’m sure it probably irritates N.N. Taleb even more.
Big Cost Needs a Big Risk Assessment
Between 2000 and 2009 natural disasters cost the federal government about $1.5 billion. Then in the following 3 years they cost $7.7 billion, $1.6 billion and $2.1 billion respectively. That’s right, in each of the last 3 years disasters have cost more than in the previous ten years combined.
This huge increase has not gone unnoticed, the federal government will initiate a Productivity Commission inquiry into national disaster funding arrangements later this year.
The inquiry will undoubtedly consider where governments are spending on disasters, but will it look at where that money is coming from?
Although state and local governments do insure some of their assets the predominant approach to funding disaster losses in Australia has been to rely on the federal government’s ability to borrow money at rock-bottom rates. This is clearly not sustainable in the long term.
There are a range of ways governments can deal with disaster costs and their variability, from public disaster funds to catastrophe linked securities. These methods can also make the cost of disasters something that’s up-front and thus give governments strong incentive to invest in mitigation.
Up-front spending requires knowledge of how much the government will need to pay in the long term. All existing estimates for annual disaster losses in Australia are based on statistics of past events. Leaving aside the future influence of climate change and demographic growth these figures are heavily flawed. Simple approaches based on historical statistics just don’t work. Disaster losses follow a power law and statistical predictions will always underestimate the probabilities of large losses.
Fortunately there is another way – a comprehensive, bottom-up National Disaster Risk Assessment.
This process would bring together the massive amounts of existing data and modelling expertise on disaster risk in Australia, identify and address gaps and refine tools to improve risk assessment. The results would enable the estimation of not only the annual costs of disasters, but also the cost of the worst disaster seasons.
Risk Assessment is more than just modelling. To get the best outcomes requires collaboration among stakeholders to share knowledge, experience and ideas for reducing disaster risk. Governments, NGOs, academia, businesses and communities all have unique abilities to reduce disaster risks and the risk modelling activities should meet their needs.
It’s in actually contributing to risk reduction that a National Disaster Risk Assessment could really see gains. Since the 2002 COAG inquiry into Natural Disasters in Australia there have been more than 160 government inquiries into disasters, producing a wish-list of close to 4000 recommendations. Though the National Strategy for Disaster Resilience has brought together key strategic priorities, the level of its implementation is unclear.
Coming out of the twin strands of data-driven risk modelling and stakeholder-driven risk assessment a more focussed approach to resilience could be taken: A 3-year National Plan with a small number of concrete, achievable priorities and clear deadlines for implementation. As these priorities are completed new ones can be added through the risk assessment process, ensuring that the National Disaster Risk Assessment is an ongoing project rather than something done once and then shelved.
A National Disaster Risk Assessment would need a custodian to ensure this continuity and ensure national risk assessment becomes a long-term activity of government. The Productivity Commission, with its modelling and consultative expertise and long history of influence of national policy could be one potential option. Or perhaps the creation of a new agency, say a National Disaster Risk Commission, could better meet this task.
Regardless, making decisions about funding future disaster losses without even really knowing what they could be is a risky game.
Natural Disasters vs. Man-made Disasters – A Better Taxonomy?
We’re always bombarded with news about natural disasters, acts of god and stories of the wrath of mother nature. It’s a recurring meme in the public discussion about disasters and even amongst disaster management experts.
But we know that so called “natural disasters” aren’t really natural – disasters are a social phenomenon – they need something to impact on before . Even talking about natural and anthropogenic hazards doesn’t really work very well. Human practices around land-clearing and vegetation management have a significant influence on floods and bushfires. Landslides that impact on human development are very often due to modifications made to slopes. And before we started building fragile structures earthquakes would have been a curiosity like solar eclipses. Then there’s climate change – we’re beginning to drive change in the natural processes that govern many hazards.
Is there a better way for talking about hazards and disasters that goes beyond this false dichotomy?
One concept that I’ve been introduced to recently is the idea of policy domains and policy communities. A policy community is the group of all the participants in the policy making and implementation process for a particular subject. Some players are only concerned with one policy area (such as engineering seismologists) whilst others are concerned with many policy areas (such as meteorologists or disaster recovery experts).
To see how this concept could be used in categorising hazards I used Gephi to build a map of various hazards and how their policy communities are connected. For example blizzards and heatwaves are connected because they both relate to meteorology and climate – there’s overlap in their policy community. An engineer may work in both the earthquake policy community, the dam failure policy community and the structural collapse policy community and so on. This is a very subjective process, without data on how experts in various fields are connected (using say LinkedIn), this is really just built on what I think. But let’s see if we can pull some groups of hazards out of this map:

Click for a larger version.
Based on the connections between the different policy communities I’ve pulled out three separate broad policy domains:
Settlements – this comprises most of the traditional natural hazards policy domain, but adds in a few other engineering related hazards such as structural collapse (which has huge overlaps with policy domains like earthquake) and dam failure (which could almost be considered a sub-speciality of the flood policy domain). The drivers and mitigation options for these hazards relate to where and how we build our houses, neighbourhoods and cities.
Society – this comprises human health, human security and agricultural hazards. This is a pretty diverse set of hazards (as evidenced by their sparse connections) but they mostly relate to people and societies. It could be broken up a bit further, but for simplicity I’ve grouped them.
Economy – this group has industrial/technological accidents, transport accidents and utilities failures, there’s pretty big overlap with terrorism (which I placed in the societal group) and a number of the Settlements policy domains. Most of these hazards relate to economic activity in the modern age and comprise most of the traditional anthropogenic hazards policy domain. I think that labelling this group Economy is instructive as it reminds us that the so-called ‘human-caused’ disasters aren’t caused by people per se, but the productive activities we do and the materials and technologies used in them. It’s this group of hazards that have evolved the fastest and continue to evolve rapidly.
So let’s forget natural hazards and anthropogenic hazards – how about Settlement hazards, Societal hazards and Economic hazards?
An Earthquake in Sydney: Could it happen here
 A few weeks ago a small earthquake shook areas of Sydney around Campbelltown. The tremor prompted an article in The Fifth Estate where experts warned that most people vastly underestimate the risks of an earthquake in Australia. Prior to this I had been researching the risk of an earthquake in Sydney as part of an assignment. I found that whilst the likelihood of a Sydney earthquake are small, the consequences could be great.
Earthquake Sources
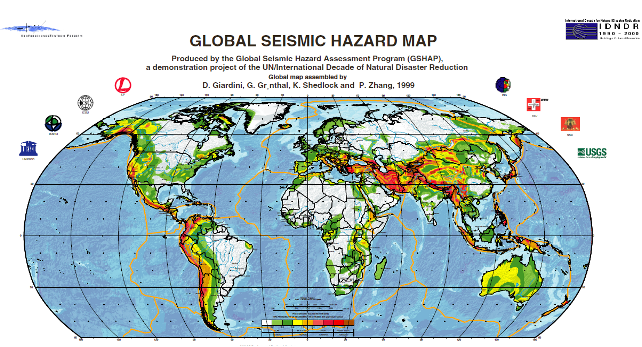
Although far from tectonic boundaries Australia is more seismically active than the interiors of other continental plates. Although these intra-plate earthquakes are less common than those that occur along plate boundaries, earthquakes with magnitude 7 or more can happen occasionally. Elsewhere in the world earthquakes of this magnitude, when they strike near major population centres, can cause significant damage and loss of life.
There are numerous faults throughout the urban area of Sydney. Although most of these show little sign of recent activity recurrence intervals on faults in Australia can measure in the order of tens to hundreds of thousands of years. At the foot of the Blue Mountains lies the 28 km long Kurrajong Fault Complex. This has been the subject of quite a bit of research as it could produce large earthquakes of magnitude 7 or greater. The likelihood of a large earthquake on this fault is highly uncertain, though it is probably smaller than 1 in 100,000 per year.
Built Environment
Sydney has a very low density. Of its 1.5 million dwellings 55% are separate houses and only 10% are in apartment buildings of 4 or more storeys. Some construction in the city survives from the early 1800s. Houses built prior to the 1930s are likely to be of poorer unreinforced masonry construction and more prone to structural damage or collapse in the event of an earthquake. Houses built since the 1980s should include modern seismic resistant elements based on the mapped hazard for Sydney at the time. Asbestos was a common construction material from 1945 to 1980 and could be disturbed by even light earthquake damage.
Sydney Airport handles 35.6 million passengers and 470,000 tonnes of cargo per year. In addition to the Airport a large amount of heavy industry is clustered around Botany Bay. This includes Port Botany, the Kurnell Refinery and Desalination Plant. All these assets are on unconsolidated or reclaimed land (notably the runways of Sydney airport) more likely to experience strong earthquake shaking.
The Earthquake Threat to Sydney

Site classes for parts of Sydney (values D, DE and E show weaker soils and thus greater amplification of earthquake shaking)
Sydney is located in a moderate earthquake hazard zone for the Australian continent. A peak ground acceleration of 0.05g has an annual exceedance probability of 1 in 500. The likelihood of of different peak ground accelerations being exceeded in the Sydney area is given in the table below. Earthquake shaking can be much worse in soft, sandy or watery soils – indeed it’s on these soils that damage is often most severe. The amplification of ground acceleration can be up to a facor of three. Although most of Sydney sits on relatively firm ground there are many areas on softer soils. The most important of these is Botany Basin, which extends north from Botany Bay almost as far as the Sydney CBD. The Botany Basin is a low-lying swampy area with a water table close to the surface. There are other smaller areas of unconsolidated sediments and fill, particularly along the foreshore of Sydney Harbour. These areas are likely to experience greater ground shaking in an earthquake than older areas which sit on consolidated rock.
| 1/500 AEP2 | 1/1000 AEP | 1/2500 AEP | |
| Peak Ground Acceleration (g) | 0.05 | 0.1 | 0.15 |
| MMI | VI | VII | VII |
| Peak Ground Acceleration with soil amplification (g) | 0.15 | 0.3 | 0.5 |
| MMI with soil amplification | VII | VIII | IX |
| Typical damage at higher MMI |
Slight damage and cracking in old buildings. Unsecured parapets, brick gables, unreinforced chimneys and tiles may fall. | Heavy damage to old poorly constructed buildings, some collapse. Some damage to reinforced masonry buildings. Houses not secured to foundations may move. | Many old buildings destroyed. Damage to reinforced masonry buildings some with partial collapse. Some damage to new structures. Houses shifted off foundations. Brick veneers fall. |
An earthquake on the Kurrajong fault complex could potentially produce even stronger shaking but is less likely.
Although these earthquakes are rare emergency planning should not be discounted. Emergency planning for flood and tsunami in NSW considers events this rare and rarer.
The combination of unconsolidated sediments and a high water table in the Botany Basin means that it may be susceptible to liquefaction. No investigations of this potential have been undertaken.
Impacts of a Sydney Earthquake
The threat of an earthquake in Sydney has received significant attention from the global reinsurance industry. In 2005 Munich Re included a Sydney earthquake as one of its top 10 scenarios for a 1000 year PML.3 Swiss Re considers an earthquake in Sydney to be one of its reference losses; an event with likelihood of 1/1,000 would have an economic loss of $20 billion.(18)
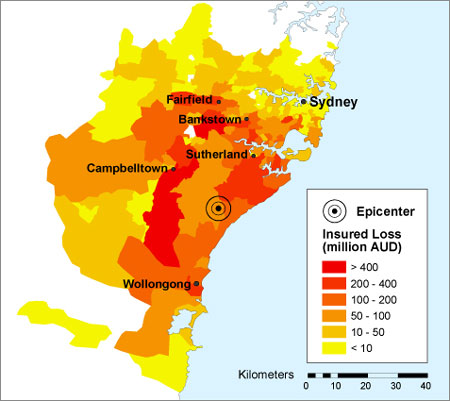
Other insurance risk modellers have prepared scenarios for an earthquake in the Sydney Basin. The one shown, estimates a loss of $11.3 billion for an earthquake of similar size to the Newcastle quake occurring 40 km south of Sydney.
A significant hazard is the collapse of unreinforced masonry awnings in older commercial districts. This was extensive in both the 1989 Newcastle and 2011 Christchurch earthquakes and led to fatalities. These awnings are prevalent in many commercial areas throughout Sydney.
Shaking amplified by local ground conditions and the possibility of liquefaction pose a potential hazard to the large industry around Botany Bay. Possible secondary impacts on travel and freight shipped through Sydney Airport and Port Botany could have flow-on economic effects to otherwise unaffected businesses. Damage to chemical plants or the Kurnell Oil refinery could lead to leaks, posing a risk to the surrounding population and having environmental impacts.
What could be done?
Research and Risk Assessment
Despite ongoing work in the Sydney Basin on earthquake hazards there is still substantial gaps in knowledge of the risk. Further research is required to address these knowledge gaps.
The seismology of possible earthquake producing faults is still not well understood. Further research on these sites would help define the probability of an earthquake occurring.
More crucial is a proper assessment of earthquake vulnerability, particularly in areas known to have a combination of old buildings and unconsolidated soils. The methodology developed by Geoscience Australia for a report on earthquake hazards in Newcastle and Lake Macquarie could be replicated across Sydney, with initial priority given to the following areas:
- The soft soils around Botany Bay
- Areas with high concentrations of old dwellings in the inner city
- Areas along Sydney harbour that have been reclaimed
Assessment of liquefaction potential in the Botany Basin and other similar areas should also be undertaken. Priority should be given to the areas that host key infrastructure, such as Sydney Airport.
A better understanding of the risk could help motivate governments to undertake mitigation and preparedness measures and prioritise areas for assessment.
Mitigation
Retrofitting of individual homes is likely to be expensive and not cost effective, however attention should be given to emergency infrastructure such as hospitals, important public buildings like schools and important heritage assets. City of Sydney Council has conducted seismic retrofitting of some of its town halls.
Special assessment should be made of masonry awnings in older commercial districts, particularly in areas where the ground conditions may lead to strong shaking. These proved to be particularly prone to collapse in the Newcastle earthquake.
Key industrial and aviation assets surrounding Botany Bay should be engaged to undertake detailed seismic risk assessments including addressing liquefaction. Retrofitting should be considered where indicated by these risk assessments. These facilities should also audit their business continuity and emergency plans to ensure minimal disruption to operations in the event of an earthquake.
Assessment of the seismic safety of bridges on Sydney’s extensive road and rail network should also be conducted.
Response Planning
The geology and urban geography of Sydney could create specific challenges for an earthquake response in Sydney. The low density of Sydney, potential for widespread shaking and areas likely to experience higher intensities due to local ground conditions will create widespread low-moderate damage with pockets of heavier damage. The low likelihood of an earthquake and lack of lived experience also pose challenges to community education and engagement. New South Wales may wish to develop a State Earthquake Emergency Sub-Plan similar to that used in Victoria. Alternatively Supporting Plans for key functions that may also be required in other disasters could be developed.
Key functions that will need to be addressed include Damage Assessment, Search and Rescue and Debris Management. Other elements of an earthquake response are already provided for in other emergency plans, however these should be reviewed to ensure that they would function appropriately in an earthquake emergency.
Damage Assessment
Damage assessment is required during the immediate response for activities like search and rescue and for the longer term recovery to determine whether buildings are safe to re-inhabit.
Use of new technologies could be used for rapid damage assessment. Creating social media and other technological solutions solely for earthquake is unlikely to be feasible, but the capacity to cope with reports of earthquake damage could be incorporated into other tools developed for hazards such as hailstorms.
Prioritising areas for longer term assessment could also be challenging, as will sourcing enough qualified engineers to conduct assessments. Rules of thumb for initial checks by unqualified personnel may need to be developed. This could identify buildings that need further inspection.
Search and Rescue
Although a substantial portion of Fire and Rescue NSW and the NSW State Emergency Service have search and rescue capabilities, including the rescue of people from collapsed and damaged structures there exists no plan for a large scale dispersed search and rescue operation.
Coordination and communication between the different rescue services will be critical to ensure that the worst affected areas receive the resources they need, yet are not overwhelmed with emergency services personnel.
Debris Management
Some areas will generate large amounts of debris as a result of destroyed structures and those needing to be demolished. Existing landfill sites are not likely to be adequate for the possibly large debris loads. This debris may also contain hazardous materials including asbestos. Careful management and disposal of this debris will be required to ensure that emergency service and waste management personnel and the broader community are not exposed.
1Local Magnitude, also known as Richter Magnitude.
2Annual Exceedance Probability: A measure of the chance per year of an event of that level or higher occurring.
3Probable Maximum Loss: A measure of the maximum loss in an insurance portfolio for a single event over a particular time period.
Risky Bites: Fukushima, is fear the real risk?
 Two new international and independent reports have been released on the health impacts of the Fukushima nuclear accident. They’ve found that there have been few health impacts on the workers in the plant and emergency responders. More importantly they’ve found that there are unlikely to be any attributable long term health impacts on the general population. As the Sydney Morning Herald article says: “This “perfect storm” hit a nuclear plant built to a 50-year-old design and no one died.”
Nevertheless, there’s been significant fallout (pun intended) in terms of the nuclear power industry in Japan and abroad. Japan has struggled to generate electricity over the last two years and public opinion on nuclear power has reached new lows. The psychological impacts cannot also be discounted for millions in the area and further afield. The report even found that many deaths were associated with the stress of the evacuation. In areas that weren’t highly exposed to radiation people may have been better off staying.
So here’s my question: is the fear of a nuclear accident a bigger risk than the risk of an accident itself?
NSW Planning White Paper Released
Today the NSW Government released its planning white paper. Reforming the planning system was one of the election policies of the O’Farrell Government. I feel that a lot of the discussion about ‘resilience’ are thinly veiled distractions from what we know works best – not building stuff in harm’s way.
I’ll be leafing through it and posting my thoughts (and perhaps making a submission), but at 214 pages it’s going to take me a while.
The closing date for submissions is the 28th of June, so if you’re thinking about making one get cracking. There’s a variety of other consultative mechanisms including a series of discussion forums.
Raising Warragamba Dam could lead to a greater catastrophe
This post originally appeared in New Matilda under the title “Floodwaters Could Rise In Sydney”
Queensland and NSW are again recovering from record breaking floods and again many are questioning the state of flood mitigation in Australia. While attention remains on flood affected parts of Queensland attention is starting to turn to what could be the worst flood risk in the country: the Hawkesbury-Nepean River in Western Sydney.
Resilience in an increasingly globalised world
This morning I read this article about pharmaceuticals and other medical products. It turns out that many essential medicines and devices have complex supply chains that depend on products produced in just a handful of locations. The supply of some of these products is vulnerable to natural disasters, civil unrest and other crises. Countries like Australia, which don’t have large pharma industries are quite vulnerable to these interruptions with potential consequences on the health of many people with chronic and acute conditions.
Emergency Services Levy: Towards a risk based approach?
The New South Wales Government has recently released a discussion paper on changes to the way the emergency services are funded in the State. Fire and Rescue NSW, the NSW Rural Fire Service and the NSW State Emergency Service currently cost about $1billion a year to run. The current model sees contributions from the insurance industry, local government and the state government towards the funding of the three services. The insurance industry contributes to 73.7% of their total budget.
This state of affairs has been widely acknowledged as being inefficient, inequitable and counter-productive. Insurance taxes have been widely acknowledged to reduce rates of insurance. Un-insurance rates in NSW are some of the highest in the country. A move towards a property based level is strongly recommended in the discussion paper which is asking for community views on the design.
Most of the questions relate to how a fair and efficient property based tax can be levied. I wish to focus on a different aspect: If the current levy disincentivises risk management measures (ie. insurance) could the future levy be designed to incentivise risk management measures?
In theory the levy could be based on a service delivery model (which do exist for the various services). However any decision to do so would be primarily based on equity grounds – this does raise the tricky question of whether you would charge on the basis of the service provided (which are generally lower in rural areas) or the cost of providing the service (which are generally higher in rural areas).
The paper dismisses the use of a risk based approach to determine a property levy as impractical, but I think it deserves closer examination. How could a risk based approach work? Would it be feasible to implement? And would it actually lead to risk reduction?
Property risk comes from two sources – the site of the property (ie. its exposure to hazards) and its construction/use (ie. its vulnerability to hazards). For hazards like urban fire and hailstorm the site doesn’t matter too much. Other hazards, such as flood and bush fire depend on both building construction and location.
Exposure to hazards
The component of the risk attached to the site of the property is very difficult to move. It’s unclear what the effect of a site-based risk levy would be. On one hand, a higher levy could increase property prices and lead to more wealthy folk moving into the area. On the other hand higher rates for disaster prone properties combined with high insurance premiums, could just end up reducing the income and wealth of those who are disaster-prone, increasing their vulnerability. Although there has been substantial research on the effect of flooding on property prices, there remains substantial methodological flaws in much of this research and more work still needs to be done. Changes to insurance costs are not a good indicator, if the prices get too high, consumers can just opt-out. And council rates are generally based on property values, not the other way around, so they too make a poor guide of how individuals would respond.
What about the construction of the property? Here retrofitting, property maintenance, the installation of safety systems and other practices (particularly for commercial and industrial sites, which I will leave out in this discussion as they’re already highly regulated and only represent a small portion of the overall risk) could make a difference.
As the list of potential anthropogenic and natural hazards is rather long I’m going to concentrate on the major ones our emergency services respond to: urban fire, bush fire, hail and windstorm and flood.
Urban Fire
Around two-thirds of all residential fires in NSW (in 2006/07, the most recent year for which data is available) were caused by some form of human action, whether through negligence, misadventure or malice. Only 8.37% of fires were due to short circuits and other electrical failure, but this is the leading cause of fires due to equipment and design failures (which make up 15% of all residential fires).
These causes are reflected in the majority of home fire advice which relates to individual and family preparedness. Additional guidance is targeted at a few electrical items such as Halogen down-lights, but even this advice is heavily weighted to maintenance and inspection. Attempting to incentivise good behaviour through behaviour based discounts to a property levy would be virtually impossible to implement (at least without your house into some sort of AI surveillance machine to make sure you’re doing things right). With few structural and non-structural measures that can be implemented to reduce fire risk that leaves fire response equipment.
Smoke Alarms are already mandatory in NSW, so no additional incentive is needed to install them. However Fire and Rescue NSW does recommend the installation of Home Sprinkler Systems, which have been proven to be very effective at preventing deaths in house fires. Given that this is a very specific measure the best form of incentive may be some form of rebate on the installation of home sprinkler systems, rather than discounts to a property levy.
Bush Fire
As with urban fire much of the potential for mitigation of bush fire relates to maintenance and inspection. However design and construction are just as important. In NSW new dwellings and renovations must comply with Planning for Bush Fire Protection. However much of the risk is associated with existing dwellings in bush fire prone areas. There is the potential to retrofit existing dwellings using the construction methods outlined in this guide published by the Victorian Country Fire Authority. Some simple measures on existing dwellings such as installing steel screens on doors and windows, enclosing under-house spaces, fitting a rooftop sprinkler system and installing gutter guards are relatively cheap and practical for almost all dwellings.
As the methods vary depending on fire hazard and existing construction – a broad incentive could be effective in letting home-owners select their own retrofitting methods. A risk rating and scoring system for various mitigation measures could form modifications for a property based levy. The number of bush fire prone properties is only a fraction of the total building stock in NSW, a carefully targeted and capped levy ‘surcharge’ with reductions based on some sort of checklist of mitigation options might work – it needs further investigation.
Hail and Wind
Roof damage due to hail and windstorms (I’m going to ignore water ingress due to poorly maintained gutters and downpipes – another maintenance issue) is one of the major areas of response for the SES and a significant cause of property damage from natural disasters.
There are a variety of trade-offs when it comes to different roof types including cost, longevity, maintenance needs, damage potential and ease of repair. Corrogated Fibro is probably the worst roofing material due to its fragility and toxic nature. However I haven’t found any quantitative research on the costs and benefits associated with different roofing materials.
Roughly three quarters of all new dwellings are constructed with tiled roofs with sheet metal and slate making up the majority of the other quarter. Tiles and slate are the most vulnerable roofing materials to hail as shown in the following table:
| Hailstone Size (cm) | Damage |
| 3.0–4.0 | Glass and plastic roofing broken |
| 4.0–5.0 | Old slate 100+ years old, Old tiles 50+ years old, cracked |
| 5.0–6.0 | Old slate tiles broken, new tiles crack |
| 6.0–7.5 | New concrete tiles and terracotta tiles break |
| 7.5–8.5 | Sheet metal dented – all other roofing broken |
| 8.5–9.0 | Sheet metal dented – all other roofing smashed |
| >9.0 | Sheet metal roofing penetrated/ cracked |
Clearly sheet metal is the most hail resistant form of roofing, and if appropriately tied can be remarkably wind resistant too. Roofs are most likely to be replaced during renovations or at the end of the roof lifespan, or after damage. Although it’s unclear what the ‘best’ material is, incentives could encourage people to replace roofs (or build with a better roof in the first place) if a levy presents a clear cost disincentive when keeping the previous material. Gathering data by visual inspection or even remote sensing should be relatively affordable and not need to be repeated too often.
Flood
If a property is to be built or renovated in a flood prone area (noting that in some areas there can be a substantial difference between a 1% AEP flood, the usual residential building standard, and the probable maximum flood) there are a number of design and construction features that can substantially reduce flood damage. These include using flood compatible materials, installing the electrical wiring higher than normal and considering the use of ground floor rooms.
For existing dwellings some of these methods can also be employed, or there are other means including a variety of temporary flood protection products that can be retrofitted on existing buildings (usually designed to keep <1m of slow moving water out of the house).
The most expensive method is house raising. There are funding sources for the raising of houses in some jurisdictions, including NSW, however these are generally only in areas with approved programs. Anecdotally there is demand for funding for these projects outside of these areas. A levy reduction could help people pay for this type of project, however I’d argue that making funds available for any property that meets a particular criteria would be a more effective method.
Although there has been substantial work done on cost benefit of around flooding, I haven’t seen any work specifically relating to property based incentives/disincentives for these measures. As with bush fire and storm, plenty of potential for mitigation – but uncertainty if a property levy approach would work.
Conclusion
There is some work happening in building design and construction in relation to climate change, including looking at regulatory mechanisms to enhance mitigation and retrofitting and incentives. However more work is needed to better understand the risk, effectiveness of retrofitting measures and community response to incentives.
The Insurance Council of Australia commissioned Deloitte to investigate a number of models for a property based levy. It did propose a risk based model calculated on an LGA-wide basis with the risk measure based on previous fire incidence in that LGA. This would not create significant differences for individual properties to create incentives. It does recommend that additional research could be conducted, and models prepared to investigate a levy raised on a per-property basis.
With significant existing risk associated with natural disasters in Australia and new development increasing risk too, all possible measures to encourage property mitigation need to be examined. A risk-based emergency services levy with discounts for mitigation could be expensive and difficult to implement, and may not encourage enough mitigation to balance out the cost of the approach. However where this balance lies has not been established by research – I think it is worth further detailed investigation.
The Census and Emergency Management
Yesterday saw the release of the first batch of data from the 2011 Australian Census and my inner statistics nerd was very excited. But the census is not just for demographers and statistics nerds – it has real practical uses for emergency managers. Here’s just a few areas where it comes in handy:
Risk Management
Risk is often characterised as Hazard X Vulnerability. Hazard is generally easy to determine and there are substantial studies on natural hazards in particular. Vulnerability can be much more difficult to determine, especially when talking about people. What makes someone vulnerable will ultimately depend on a host of complicated factors and relationships, but demographic data can provide some coarse indicators.
A description of a community and its vulnerabilities is grounded in solid demographic data, the best of which comes from the census. It can suggest specific issues in a community and allow researchers to target further work to better reveal and understand its vulnerabilities.
The census reveals a raft of data about socioeconomic status, education, age, family characteristics, motor vehicle ownership, English language ability and employment. It can help identify communities where there are concentrations of people who may be more vulnerable in the event of a disaster and thus at higher risk. This can inform risk assessments and ultimately target mitigation and preparedness measures at these communities.
Evacuation
Modern evacuation management depends on demographic data to ensure that the population of an area can be evacuated safely in the event of an emergency. It is particularly relevant for emergencies where there is some warning such as floods, tropical cyclones and bush fires. Here are some key items useful in evacuation planning which can be derived from census data:
Total Population: This number isn’t as important as you might think, but it’s a good starting point. Evacuation centres need to be able to cope with evacuees who go there, but most people who evacuate prefer to stay with friends and family. Still the total population can give an indication of the number of people evacuation centres may need to assist.
Number of households: Although technologically based systems, such as Emergency Alert in Australia, are being increasingly utilised by the emergency services doorknocking remains a mainstay of evacuation warning. It is an effective means of warning, particularly when combined with other methods such as mass media and new technology. Doorknocking is resource intensive in terms of personnel and time. To know how many teams you need or how long it will take you need to know the number of doors that need to be knocked. The census provides answer in the number of households in an area.
Number of cars: In Australia and most other developed nations motor vehicles are the traditional method of evacuation. Australian emergency managers pioneered simple methods for calculating the time required to evacuate an area along a limited number of routes. The number of motor vehicles is a key factor in this calculation. Most households will take all their cars with them, so you can’t just rely on household numbers. With the rise in number of motor vehicles per household, knowledge of the number and growth over time in an area is critical to ensuring safe evacuation.
Number of households without cars: This is a critical factor to ensure that sufficient alternative transport is provided to evacuate those without a vehicle.
Number of vulnerable people: Those who are elderly, have a disability or are from a Non-English Speaking background may find it difficult to either evacuate on their own, or understand the evacuation warnings. These people are present in all areas, but if the census identifies a particular concentration this can allow for emergency planners to take their needs into account and plan accordingly.
Census data can also show changes in population in an area over time indicating when evacuation routes may reach capacity. This should trigger the need to either curb development or increase the capacity of these routes.
Community Engagement
Community engagement material and programs will function best if they are targeted and tailored to the at risk communities. Some of the useful census data for community engagement includes:
Language: A common and relatively cheap option is to reprint preparedness materials in different languages and then distribute these materials among the communities who speak that language.
Non-Private Dwellings: The census doesn’t just count people at home. It counts people in hospitals, prisons and other institutions. This can help emergency managers identify areas with a large concentration of facilities like nursing homes and hotels, which need to be targeted with education materials specific to their circumstances.
Private Dwelling types: The types of private dwellings in an area and the number of people in them can also suggest how community engagement should be targeted. For example caravans are a high risk group combining both high hazard (caravan parks are often in hazard prone areas) and high vulnerability (long term residents of caravan parks often have low socioeconomic status and may also be elderly or have a disability). Census data can identify at a broad scale areas with large concentrations of caravan residents enabling emergency managers to locate the individual parks and target education efforts.
New features in the 2011 census
There have been some changes to the way the census data is packaged for use. Of particular relevance to emergency managers are changes to the geographical areas on which census data is reported have improved in granularity. This allows emergency managers to examine demographic data on much smaller areas. Over time this will enable approaches that are increasingly customised towards communities.
