Home » Posts tagged 'Australia'
Tag Archives: Australia
City of Sydney joins 100 Resilient Cities Campaign

Today the Rockefeller Foundation announced its latest group in the 100 Resilient Cities program. I was surprised to find Sydney as one of the cities who are now part of the program.
Except it’s not Sydney it’s the City of Sydney, one of the 40 or so local governments that make up the real Sydney metro area. Depending on how you want to measure resilience it’s probably one of the more resilient, if not the most resilient LGA in the Sydney Metro area. And with the possible exception of terrorism it would be on the lower side in terms of hazard profile too.
It contains 4% of the population and just 0.2% of the land area in the metropolitan region. It does however account for 28% of the Gross Regional Product, 25% of the jobs and 13% of the businesses of the Sydney metro area. However this economic contribution is heavily dependent on the rest of the metro area. Extreme interconnectedness is one of the things that reduces resilience and improved collaboration is one of the best ways to build it.
If City of Sydney is really serious about being a resilient city it will need to engage heavily with a much broader set of partners including the State Government and the other 40-odd local governments in the metro area. It will also need to ensure that the benefits it gains from being part of the Rockefeller collaboration are shared amongst these partners.
There is currently no city-wide emergency management or resilience forum in Sydney. Perhaps this grant will be the impetus that establishes one.
Highly fragmented local government is not unusual according to data from the OECD, with the average across 275 metro areas being 74 local governments (and that’s not even counting other levels or single purpose local governments). A number of other cities in the 100 resilient cities campaign have similar problems of fragmentation, and it’s not clear whether its something that’s even being considered.
It’s going to be interesting to see how the City of Sydney handles this issue moving forward with the program (and for that matter who gets the Chief Resilience Officer job). I’ll be staying tuned.
Australian Federal Budget: Bad News for Disasters
Well the Abbot Government’s first budget and it ain’t pretty. Here’s a roundup of all the new measures and cuts related to disasters. Although there’s a few new measures (such as the back-to-the-future National Bushfire Mitigation Programme) most of the ‘new’ spending are really the continuation of programs from previous governments.
New and continued spending
- Stronger biosecurity and quarantine arrangements – $20 million over 4 years
- Up to $320 million in assistance for drought affected farmers. However most of this is in the form of concessional loans or is contingent on state co-payments. Much of this spending is largely consistent with that of previous governments.
- National Bushfire Mitigation Programme – $15 million over 3 years
- Expanding research at the Australian Institute of Tropical Health and Medicine – $42 million over 4 years, though it’s unclear whether this will be offset by cuts elsewhere in the Australian Research Council’s budget.
- $9 million over three years for the continuation of the National Climate Change Adaptation Research Facility (though this is a drop in the amount of funding compared to previous governments).
- Addressing insurance costs in North Queensland. $12.5 million in grants to bodies corporate to undertake engineering assessments of strata properties to understand natural disaster risks and identify mitigation measures. This initiative will also establish an insurance comparison website for home building and contents and strata insurance for North Queensland.
- Continue the Natural Disaster Resilience Program and the National Partnership on pest and disease preparedness and response programmes (although with reduced funding)
Cuts
- Closure of the Australian Emergency Management Institute. Some of its programs will be transitioned to a ‘virtual’ institute.
- Cuts of $7.6 billion to foreign aid over 5 years
- Cut the Exotic Disease Preparedness Program
- Merger of a number of biosecurity committees and working groups
- Cuts of $10 million over 4 years to the Bureau of Meteorology
- Cuts of $21.7 million over 4 years by merging the National Environmental Research Programme and the Australian Climate Change Science Programme
- Cease the National Insurance Affordability Initiative which had a number of activities related to flood risk management at a saving of $72.2 million
I’ve sourced these all from the budget papers. Let me know in the comments if I’ve missed anything.
Big Cost Needs a Big Risk Assessment
Between 2000 and 2009 natural disasters cost the federal government about $1.5 billion. Then in the following 3 years they cost $7.7 billion, $1.6 billion and $2.1 billion respectively. That’s right, in each of the last 3 years disasters have cost more than in the previous ten years combined.
This huge increase has not gone unnoticed, the federal government will initiate a Productivity Commission inquiry into national disaster funding arrangements later this year.
The inquiry will undoubtedly consider where governments are spending on disasters, but will it look at where that money is coming from?
Although state and local governments do insure some of their assets the predominant approach to funding disaster losses in Australia has been to rely on the federal government’s ability to borrow money at rock-bottom rates. This is clearly not sustainable in the long term.
There are a range of ways governments can deal with disaster costs and their variability, from public disaster funds to catastrophe linked securities. These methods can also make the cost of disasters something that’s up-front and thus give governments strong incentive to invest in mitigation.
Up-front spending requires knowledge of how much the government will need to pay in the long term. All existing estimates for annual disaster losses in Australia are based on statistics of past events. Leaving aside the future influence of climate change and demographic growth these figures are heavily flawed. Simple approaches based on historical statistics just don’t work. Disaster losses follow a power law and statistical predictions will always underestimate the probabilities of large losses.
Fortunately there is another way – a comprehensive, bottom-up National Disaster Risk Assessment.
This process would bring together the massive amounts of existing data and modelling expertise on disaster risk in Australia, identify and address gaps and refine tools to improve risk assessment. The results would enable the estimation of not only the annual costs of disasters, but also the cost of the worst disaster seasons.
Risk Assessment is more than just modelling. To get the best outcomes requires collaboration among stakeholders to share knowledge, experience and ideas for reducing disaster risk. Governments, NGOs, academia, businesses and communities all have unique abilities to reduce disaster risks and the risk modelling activities should meet their needs.
It’s in actually contributing to risk reduction that a National Disaster Risk Assessment could really see gains. Since the 2002 COAG inquiry into Natural Disasters in Australia there have been more than 160 government inquiries into disasters, producing a wish-list of close to 4000 recommendations. Though the National Strategy for Disaster Resilience has brought together key strategic priorities, the level of its implementation is unclear.
Coming out of the twin strands of data-driven risk modelling and stakeholder-driven risk assessment a more focussed approach to resilience could be taken: A 3-year National Plan with a small number of concrete, achievable priorities and clear deadlines for implementation. As these priorities are completed new ones can be added through the risk assessment process, ensuring that the National Disaster Risk Assessment is an ongoing project rather than something done once and then shelved.
A National Disaster Risk Assessment would need a custodian to ensure this continuity and ensure national risk assessment becomes a long-term activity of government. The Productivity Commission, with its modelling and consultative expertise and long history of influence of national policy could be one potential option. Or perhaps the creation of a new agency, say a National Disaster Risk Commission, could better meet this task.
Regardless, making decisions about funding future disaster losses without even really knowing what they could be is a risky game.
Do we really need double the firefighters?
The reborn Climate Council has recently put out a new report on the projected impact of climate change on bushfires. Most of the content is backed up by sound research and pretty decent science, but some of the media coverage is focussing on a supposed doubling in the need for fire-fighters by 2030.
I’ve long been wary of claims that climate change requires massive investment in the emergency services – the problem of increasing bushfire or flood risks are better dealt with using disaster mitigation measures like land-use planning, building controls
Let’s unpack this claim a bit. The executive summary of the Climate Council report says it as thus:
By 2030, it has been estimated that the number of professional firefighters will need to approximately double (compared to 2010) to keep pace with increased population, asset value, and fire danger weather.
This was sourced from a 2013 report titled Firefighters and climate change: The human resources dimension of adapting to climate change prepared by the National Institute for Economic and Industry Research for the United Firefighters Union (I’m going to leave aside the obvious question of bias here and stick to the content).
It focusses on full-time firefighters of which there are about 11,500 in Australia in addition to the FTE of 1700 part-time firefighters and 220,000 volunteer firefighters. It’s these 11,500* who are counted as professional firefighters in the report.
I’m going to focus on the projections for NSW for time constraints.
In its future projection of fire-fighting resource requirement the NIEIR report examines two drivers:
- Population and asset growth
- Increased response due to climate change
First, population and asset growth. Here’s the projections of firefighter numbers that the report says would be required to maintain existing levels of firefighter cover of population and assets in NSW.
| 2010 | 2015 | 2020 | 2025 | 2030 | |
| NSW Firefighter projections(NIEIR) | 3604 | 3999 | 4424 | 4706 | 4991 |
This is an annual growth rate of 2.1-2.2% to 2020 and 1.2-1.3% between 2020 and 2030.
But the population of NSW is not growing this fast. Over the next 20 years the ABS estimates that population growth will average somewhere between 0.9% and 1.3%. So that leaves the rest of the projected growth due to increases in asset value. But does asset value make sense as a basis for estimating fire cover?
Not really – assets are property and a property will increase in value over time (due to inflation, rising replacement costs, increasing land value etc.) even though the property itself (and thus the number of firefighters needed to put it out if it’s on fire) remains unchanged. Population growth should be able to account for the increasing physical units of stuff (houses, businesses, vehicles etc.) that firefighters provide protection to. Maybe, though there’s other drivers?
So let’s look at responses by Fire and Rescue NSW over the last 15 years. The following chart shows their activities per 100,000 of population (culled from their annual reports)
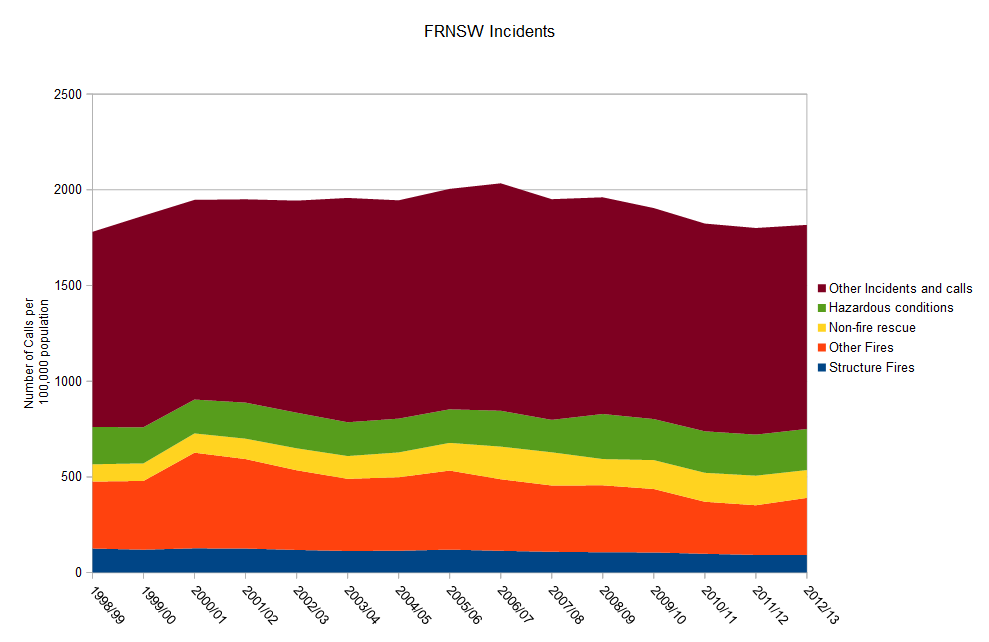
Click to engraphenate
The first thing we notice is that fires make up a relatively small proportion of the overall activity of Fire and Rescue NSW (and this is similar to other urban fire organisations across the country). The second thing we note is that the total number of incidents as a proportion of population is unchanged over the last 15 years. That is – population alone can explain any increase in the activity of Fire and Rescue NSW.
One thing that might be harder to see on the graph is that the number of fire incidents is actually going down. This is particularly the case with structure fires which have decreased by 32% over the last 15 years, per 100,000 population. Other fires have also dropped, by 42% – though the reduction in fire response has been offset by increases in non-fire rescue (57%) and Hazmat incidents** (20%). The increase in non-fire rescues is likely due to expansion in the land rescue areas that FRNSW is responsible for.
The decline in structure fires makes sense – we’re building safer buildings (code compliant, better electricals, fire safety measures etc.) and we’re also behaving safer (mostly because fewer people are smoking in bed). Landscape fires (bush and grass fires) make up about a third of the ‘Other Fires’ category, but I don’t have enough data to break this category down across a decent time series to identify any trends.
The Total Incidents tells the story though – there’s no basis for assessing growth in overall demand of full-time firefighters on anything but population. So on the basis of population growth the resource requirements for FRNSW full-time firefighters looks something like this:
| 2010 | 2015 | 2020 | 2025 | 2030 | |
| NSW Firefighter projections(population based) | 3516*** | 3572 | 3807 | 4042 | 4230 |
This produces a much more sensible growth rate.
Now let’s turn to climate change. Again here are the NIEIR projections for NSW, this time with added rows for a Low (H2) and High(H3) climate change scenario.
| 2010 | 2015 | 2020 | 2025 | 2030 | |
| NSW NIEIR | 3604 | 3999 | 4424 | 4706 | 4991 |
| H2 NIEIR | 4741 | 5728 | |||
| H3 NIEIR | 5175 | 6759 |
The NIEIR methodology hinges on a correlation they found between the number of Landscape fires in Victoria as set out in the 2012 Report on Government Services and the number of total fire ban days (both partial and statewide) declared in Victoria in any one fire season as enumerated in the CFA Annual Reports. By my count that’s a measly 5 data points.
Here’s the plot of the number of total fire ban days versus the number of landscape fires in Victoria.
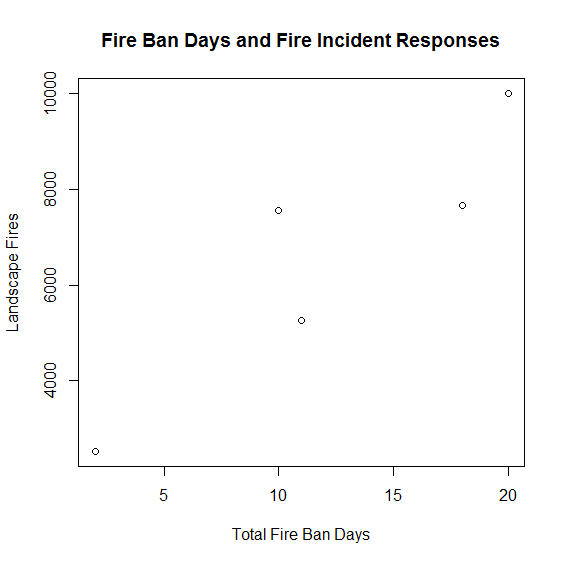
There’s a reasonably strong positive relationship there (correlation coefficient ~0.9) – but it’s only 5 data points. NIEIR could really have done better than that. The response could be substantially more noisy than appears or even non-linear. They’ve also assumed that this relationship would hold everywhere.
NIEIR then uses an excellent report prepared in 2007 by the Bushfire CRC, CSIRO and the BoM for the Climate Institute which examined, amongst other things the expected change in days with FFDI>50 (on which Total Fire Bans are generally declared) under a variety of climate change scenarios.
Now here the outline of the methodology begins to get a bit shaky. They seem to have applied some sort of modifier to take into account fewer bushfires in urban and arid areas (which is sensible) and matched similar sites in western and northern Australia with those in the Lucas paper (which is not sensible – the climate regimes are unlikely to change in similar ways) to produce area estimates of the increase in firefighters due to both climate change and population/asset growth.
Now here comes the kicker – best as I can figure out (by reverse engineering the math) NIEIR has assumed that the increase would apply to all incident types responded to by professional fire fighters, not just the landscape fires that make up about 5-10% of all incidents responded to by full-time firefighters. Even a doubling in the number of Extreme fire danger days, which is likely in some but not all areas, would only increase the overall taskload of NSW full-time firefighters by 4-6%. This is actually within the annual variation in incident numbers in NSW, suggesting that on this crude measure it would be possible for additional response to climate change to be handled within population adjusted resourcing.
On the other hand the resource requirements of the volunteer fire services (where a much larger propotion of the taskload is made up of bushfires) could be more severely impacted. Unfortunately I don’t think that these type of analyses really provide much information for emergency managers to plan future resource requirements in response to climate change. The impact of climate change on emergency services will be most keenly felt in extreme events – where you’re more interested in surge capacity and where part-time firefighters and volunteers play a much larger role. A scenario approach to modelling resource requirements during these extremes would provide much more insight into what we really do need for the greater amount of extreme weather in the future.
In the meantime it sadly seems that the Climate Council lacks the resources to adequately check its sources, especially when they come from the gray literature. Here’s hoping that they can encourage some work to get the real answers on human resource requirements for extreme fires under climate change.
* The report also discusses some of the problems in counting how many full-time firefighters there are in Australia, it uses a figure of 12,041 which is calculated from Census responses. I’ve taken the figure from the Productivity Commission’s Report on Government Services – so this is an approximate figure.
** I’m not very confident about this figure – FRNSW have changed their way of categorising hazmat incidents over the years, so a small change here may have been offset by a small change in one of the other incident categories – probably other. I’ve applied all the usual statistical tests and these changes are significant – just as there is no significant change to the Other incidents category or the Total incidents overall.
*** Here I’ve used the number of full-time firefighters contained in the FRNSW Annual Report.
An Earthquake in Sydney: Could it happen here
 A few weeks ago a small earthquake shook areas of Sydney around Campbelltown. The tremor prompted an article in The Fifth Estate where experts warned that most people vastly underestimate the risks of an earthquake in Australia. Prior to this I had been researching the risk of an earthquake in Sydney as part of an assignment. I found that whilst the likelihood of a Sydney earthquake are small, the consequences could be great.
Earthquake Sources
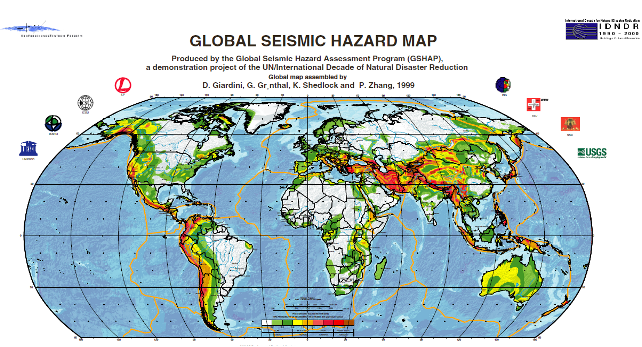
Although far from tectonic boundaries Australia is more seismically active than the interiors of other continental plates. Although these intra-plate earthquakes are less common than those that occur along plate boundaries, earthquakes with magnitude 7 or more can happen occasionally. Elsewhere in the world earthquakes of this magnitude, when they strike near major population centres, can cause significant damage and loss of life.
There are numerous faults throughout the urban area of Sydney. Although most of these show little sign of recent activity recurrence intervals on faults in Australia can measure in the order of tens to hundreds of thousands of years. At the foot of the Blue Mountains lies the 28 km long Kurrajong Fault Complex. This has been the subject of quite a bit of research as it could produce large earthquakes of magnitude 7 or greater. The likelihood of a large earthquake on this fault is highly uncertain, though it is probably smaller than 1 in 100,000 per year.
Built Environment
Sydney has a very low density. Of its 1.5 million dwellings 55% are separate houses and only 10% are in apartment buildings of 4 or more storeys. Some construction in the city survives from the early 1800s. Houses built prior to the 1930s are likely to be of poorer unreinforced masonry construction and more prone to structural damage or collapse in the event of an earthquake. Houses built since the 1980s should include modern seismic resistant elements based on the mapped hazard for Sydney at the time. Asbestos was a common construction material from 1945 to 1980 and could be disturbed by even light earthquake damage.
Sydney Airport handles 35.6 million passengers and 470,000 tonnes of cargo per year. In addition to the Airport a large amount of heavy industry is clustered around Botany Bay. This includes Port Botany, the Kurnell Refinery and Desalination Plant. All these assets are on unconsolidated or reclaimed land (notably the runways of Sydney airport) more likely to experience strong earthquake shaking.
The Earthquake Threat to Sydney

Site classes for parts of Sydney (values D, DE and E show weaker soils and thus greater amplification of earthquake shaking)
Sydney is located in a moderate earthquake hazard zone for the Australian continent. A peak ground acceleration of 0.05g has an annual exceedance probability of 1 in 500. The likelihood of of different peak ground accelerations being exceeded in the Sydney area is given in the table below. Earthquake shaking can be much worse in soft, sandy or watery soils – indeed it’s on these soils that damage is often most severe. The amplification of ground acceleration can be up to a facor of three. Although most of Sydney sits on relatively firm ground there are many areas on softer soils. The most important of these is Botany Basin, which extends north from Botany Bay almost as far as the Sydney CBD. The Botany Basin is a low-lying swampy area with a water table close to the surface. There are other smaller areas of unconsolidated sediments and fill, particularly along the foreshore of Sydney Harbour. These areas are likely to experience greater ground shaking in an earthquake than older areas which sit on consolidated rock.
| 1/500 AEP2 | 1/1000 AEP | 1/2500 AEP | |
| Peak Ground Acceleration (g) | 0.05 | 0.1 | 0.15 |
| MMI | VI | VII | VII |
| Peak Ground Acceleration with soil amplification (g) | 0.15 | 0.3 | 0.5 |
| MMI with soil amplification | VII | VIII | IX |
| Typical damage at higher MMI |
Slight damage and cracking in old buildings. Unsecured parapets, brick gables, unreinforced chimneys and tiles may fall. | Heavy damage to old poorly constructed buildings, some collapse. Some damage to reinforced masonry buildings. Houses not secured to foundations may move. | Many old buildings destroyed. Damage to reinforced masonry buildings some with partial collapse. Some damage to new structures. Houses shifted off foundations. Brick veneers fall. |
An earthquake on the Kurrajong fault complex could potentially produce even stronger shaking but is less likely.
Although these earthquakes are rare emergency planning should not be discounted. Emergency planning for flood and tsunami in NSW considers events this rare and rarer.
The combination of unconsolidated sediments and a high water table in the Botany Basin means that it may be susceptible to liquefaction. No investigations of this potential have been undertaken.
Impacts of a Sydney Earthquake
The threat of an earthquake in Sydney has received significant attention from the global reinsurance industry. In 2005 Munich Re included a Sydney earthquake as one of its top 10 scenarios for a 1000 year PML.3 Swiss Re considers an earthquake in Sydney to be one of its reference losses; an event with likelihood of 1/1,000 would have an economic loss of $20 billion.(18)
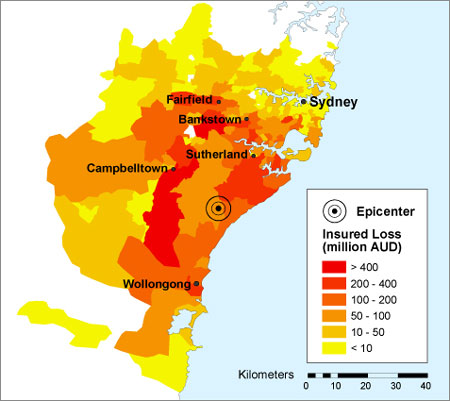
Other insurance risk modellers have prepared scenarios for an earthquake in the Sydney Basin. The one shown, estimates a loss of $11.3 billion for an earthquake of similar size to the Newcastle quake occurring 40 km south of Sydney.
A significant hazard is the collapse of unreinforced masonry awnings in older commercial districts. This was extensive in both the 1989 Newcastle and 2011 Christchurch earthquakes and led to fatalities. These awnings are prevalent in many commercial areas throughout Sydney.
Shaking amplified by local ground conditions and the possibility of liquefaction pose a potential hazard to the large industry around Botany Bay. Possible secondary impacts on travel and freight shipped through Sydney Airport and Port Botany could have flow-on economic effects to otherwise unaffected businesses. Damage to chemical plants or the Kurnell Oil refinery could lead to leaks, posing a risk to the surrounding population and having environmental impacts.
What could be done?
Research and Risk Assessment
Despite ongoing work in the Sydney Basin on earthquake hazards there is still substantial gaps in knowledge of the risk. Further research is required to address these knowledge gaps.
The seismology of possible earthquake producing faults is still not well understood. Further research on these sites would help define the probability of an earthquake occurring.
More crucial is a proper assessment of earthquake vulnerability, particularly in areas known to have a combination of old buildings and unconsolidated soils. The methodology developed by Geoscience Australia for a report on earthquake hazards in Newcastle and Lake Macquarie could be replicated across Sydney, with initial priority given to the following areas:
- The soft soils around Botany Bay
- Areas with high concentrations of old dwellings in the inner city
- Areas along Sydney harbour that have been reclaimed
Assessment of liquefaction potential in the Botany Basin and other similar areas should also be undertaken. Priority should be given to the areas that host key infrastructure, such as Sydney Airport.
A better understanding of the risk could help motivate governments to undertake mitigation and preparedness measures and prioritise areas for assessment.
Mitigation
Retrofitting of individual homes is likely to be expensive and not cost effective, however attention should be given to emergency infrastructure such as hospitals, important public buildings like schools and important heritage assets. City of Sydney Council has conducted seismic retrofitting of some of its town halls.
Special assessment should be made of masonry awnings in older commercial districts, particularly in areas where the ground conditions may lead to strong shaking. These proved to be particularly prone to collapse in the Newcastle earthquake.
Key industrial and aviation assets surrounding Botany Bay should be engaged to undertake detailed seismic risk assessments including addressing liquefaction. Retrofitting should be considered where indicated by these risk assessments. These facilities should also audit their business continuity and emergency plans to ensure minimal disruption to operations in the event of an earthquake.
Assessment of the seismic safety of bridges on Sydney’s extensive road and rail network should also be conducted.
Response Planning
The geology and urban geography of Sydney could create specific challenges for an earthquake response in Sydney. The low density of Sydney, potential for widespread shaking and areas likely to experience higher intensities due to local ground conditions will create widespread low-moderate damage with pockets of heavier damage. The low likelihood of an earthquake and lack of lived experience also pose challenges to community education and engagement. New South Wales may wish to develop a State Earthquake Emergency Sub-Plan similar to that used in Victoria. Alternatively Supporting Plans for key functions that may also be required in other disasters could be developed.
Key functions that will need to be addressed include Damage Assessment, Search and Rescue and Debris Management. Other elements of an earthquake response are already provided for in other emergency plans, however these should be reviewed to ensure that they would function appropriately in an earthquake emergency.
Damage Assessment
Damage assessment is required during the immediate response for activities like search and rescue and for the longer term recovery to determine whether buildings are safe to re-inhabit.
Use of new technologies could be used for rapid damage assessment. Creating social media and other technological solutions solely for earthquake is unlikely to be feasible, but the capacity to cope with reports of earthquake damage could be incorporated into other tools developed for hazards such as hailstorms.
Prioritising areas for longer term assessment could also be challenging, as will sourcing enough qualified engineers to conduct assessments. Rules of thumb for initial checks by unqualified personnel may need to be developed. This could identify buildings that need further inspection.
Search and Rescue
Although a substantial portion of Fire and Rescue NSW and the NSW State Emergency Service have search and rescue capabilities, including the rescue of people from collapsed and damaged structures there exists no plan for a large scale dispersed search and rescue operation.
Coordination and communication between the different rescue services will be critical to ensure that the worst affected areas receive the resources they need, yet are not overwhelmed with emergency services personnel.
Debris Management
Some areas will generate large amounts of debris as a result of destroyed structures and those needing to be demolished. Existing landfill sites are not likely to be adequate for the possibly large debris loads. This debris may also contain hazardous materials including asbestos. Careful management and disposal of this debris will be required to ensure that emergency service and waste management personnel and the broader community are not exposed.
1Local Magnitude, also known as Richter Magnitude.
2Annual Exceedance Probability: A measure of the chance per year of an event of that level or higher occurring.
3Probable Maximum Loss: A measure of the maximum loss in an insurance portfolio for a single event over a particular time period.
State of Emergency – What powers does it add?
For the second time in 18 months NSW is under a State of Emergency due to a natural disaster. You can read the wording of the declaration here.
From memory, before the flooding in 2012 there have only been two declarations of a State of Emergency in NSW under the current legislation.
- 1998 – After the Longford Gas explosion in Victoria to cut off supplies in NSW border areas that were supplied from Victoria.
- 1991 – During a Blue Green Algae outbreak in the Darling River to put the Public Works Department in charge of the government response.
A State of Emergency is declared under the State Emergency and Rescue Management Act to give emergency services extraordinary powers to combat an emergency situation. These powers are usually more extensive than those available to the emergency services under their own acts (in this case the Rural Fires Act).
I thought it might be interesting to do a play by play comparison of the powers under each act. This is necessarily a simplification, if you’re interested or need to use this stuff you need to read each Act, their Regulations or even get legal advice.
A few quick notes. Not all RFS Members are Officers for the purposes of the Act. I’m not sure which rank confers these powers or whether they’re delegated in another fashion, but if anyone knows I’d appreciate it. An Emergency Services Officer for the purposes of the SERM Act include RFS members of or above the position of Deputy Captain.
Coordination and Direction
Under the RFS Act
Who Exercises it?: The Commissioner of the RFS (s44)
What is it’s extent? When a Section 44 bushfire emergency is declared the Commissioner or delegate (in reality, the incident management teams) take control of the bushfire response. Directions can be issued to the RFS, Fire and Rescue NSW, the NSW Police Force and other persons in connection with fire fighting operations. (s45)
Under the SERM Act
Who Exercises it?: The Minister
What is it’s extent? The Minister gains the ability to direct the entire resources of government in the emergency response – even if those directions are contrary to other legislation or law (with the exception of the Essential Services Act). (s36)
Comments
In my opinion this is one of the most important provisions of the State of Emergency powers – Michael Eburn covers it in his excellent post on the State of Emergency declaration here.
Evacuation
Under the RFS Act
Who Exercises it? RFS Officers
What is it’s extent? Only if a person, vehicle or thing is interfering with RFS Operations. (s22A)
Under the SERM Act
Who Exercises it?: Emergency Services Officers where authorised by the Minister
What is it’s extent? Evacuate and remain out of the emergency area, these powers include the use of force. (s37)
Comments
The RFS does not have any power to evacuate people for their safety, so if they believe it is necessary They could rely on common law powers of the Police to detain and remove people from an area for their own safety, but a State of Emergency is likely to produce much greater levels of compliance and require less use of force. However this does raise the question of whether the RFS should have the power under their own act to ‘force’ evacuations. The traditional paradigm in community response to fires has been to leave it up to the community to decide. Recently we’ve seen a trend towards strongly advising people to evacuate in the worst fires – and an overall preference to evacuation as the safest measure. The State Emergency Service has significant evacuation powers under their Act in the case of flood emergencies, which can even include the use of force. To give the RFS greater powers to evacuate people would give them more options in the event of a fire without needing to resort to a State of Emergency.
Entry
Under the RFS Act
Who Exercises it? RFS Officers in the possession of a written authority (s32) and in some circumstances providing notice (s29)
What is it’s extent? Any premises to exercise their functions. (s23)
Under the SERM Act
Who Exercises it?: Any person in possession of a written authority (s37F) and in some circumstances providing notice (s37C)
What is it’s extent? To comply with a direction to undertake safety measures in section 37.
Road Closure
Under the RFS Act
Who Exercises it? Officers in charge of RFS brigades
What is it’s extent? Any road in the vicinity of a fire (and the RFS do not need to be controlling that closure – they can instruct somebody else to do so) (s24)
Under the SERM Act
Who Exercises it?: Emergency Services Officers where authorised by the Minister
What is it’s extent? Any road in an emergency area (and the emergency services officer does not need to ‘man’ the closure) (s37A)
Pulling down buildings and other safety measures
Under the RFS Act
Who Exercises it? RFS Officers
What is it’s extent? To protect life and property destroy buildings, fences, vegetation or establish fire breaks (and the RFS can instruct somebody else to do so) (s25)
Under the SERM Act
Who Exercises it?: Emergency Services Officers where authorised by the Minister can direct actions to
What is it’s extent? Pulling down or destroying damaged walls or premises. The destruction or removal of any material or thing that threatens life or property or inhibits the emergency response. (s37A)
Use of Force
Under the RFS Act
Who Exercises it? RFS Officers where authorised by the Commissioner
What is it’s extent? Only for the purpose of gaining entry (s31)
Under the SERM Act
Who Exercises it?: Persons where authorised by the Minister.
What is it’s extent? Only for the purpose of gaining entry (s37E)
Commandeering Property
Under the RFS Act
Who Exercises it? RFS Officers
What is it’s extent? Take and use without payment any water on any land. (s26)
Under the SERM Act
Who Exercises it?: The Minister
What is it’s extent? Take possession of and use any property. The property owner may receive but is not entitled to compensation.
Disconnection of Utilities
Under the RFS Act
None.
Under the SERM Act
Who Exercises it?: Emergency Services Officers where authorised by the Minister can direct actions to
What is it’s extent? Shutting off of any main supply of gas, water or other substance or gas or electricity to premises in the emergency area. (s37A)
Protection from Liability
Under the RFS Act
Who Exercises it? Any officer or member of the RFS, other fire fighting agencies or those acting under their direction
What is it’s extent? Protected persons (or the Crown) cannot be held liable for actions done in good faith.
Under the SERM Act
Who Exercises it?: Any person acting under the execution of a State of Emergency.
What is it’s extent? Protected persons (or the Crown) cannot have legal proceedings brought against them for actions done in good faith.
Risky Links: NSW Bushfires
I was going to write a post on the Bushfires in NSW, links to climate change and the media discussion after Adam Bandt’s comments (though I do wish to point out the irony that many of those criticising Bandt’s timing are more than happy to blame the fires on Green ideas about land clearing) but others have said it better than I. Here’s a wrap of some of the best coverage to date on the fires:
David Holmes in the Conversation looks at the media discussion of the bushfires and climate change. Despite calls not to ‘politicise’ research shows that now is the best time to talk about extreme weather and climate change. Also read Adam Bandt’s article that started it in The Guardian.
In the Guardian Josh Taylor outlines the benefits of social media in keeping tabs on what’s happening, but that it has its drawbacks too.
Although the fire season is likely to lengthen in the future detecting historical changes in seasonality is difficult as David Bowman examines in Crikey.
Also in The Conversation Ross Bradstock looks at the reasons why the Blue Mountains is so vulnerable to bushfires and Janet Stanley covers climate change, arson and land use as three areas that need a greater focus on prevention.
The Australian argues that despite losses and the early arrival of the bushfire season we are getting better at Bushfire Management. Technology is improving how fires are fought as detailed in the Daily Telegraph but models are far from reliable, as pointed out by David Bowman in the Conversation.
Risky Links: IDDR 2013
Today is International Day for Disaster Reduction, check out the website here and be sure to look at the results from the IDDR survey which looks at the contributions and needs of people with disabilities in disaster risk reduction. Their number one priority? Information.
Meanwhile in India Super cyclonic storm Phailin: the strongest cyclone ever in the North Indian Ocean Basin, made landfall yesterday – this piece in The Conversation gives some background. Check out the Hindustan Times for ongoing coverage.
And unseasonably hot weather in Australia has sparked a string of damaging bushfires predictably leading to calls for greater prescribed burning. However, planned burning is not necessarily as effective as many think. The design of bushfire mitigation activities needs to take science into account. These fires come as research to be published in Nature on Monday suggest the El Nino Southern Oscillation cycle will strengthen as a result of climate change, intensifying drought and bushfire risk. Even more concerning is new research showing that more than two-thirds of people would adopt a ‘wait and see’ approach when deciding to evacuate or defend in the face of a bushfire. Less than 1% would leave their homes on days of catastrophic or extreme fire danger – the safest option.
Risky Links
With my studies soon to be commencing I’m going to be reading a lot more. Thus each week I’ll post a set of links of interesting articles across the web on risk and disaster management. Here’s this week’s list, happy reading:
- Chemical Weapons and the Scientists who make them – a brief history of the development of chemical weapons, some of the notable scientists who helped in their creation and the treaties prohibiting their use (did you know that Syria is not a signatory to the 1997 Chemical Weapons Convention).
- What Did Chicago Look Like Before the Great Fire? – a great map comparing the city of Chicago before the great fire of 1871 and an aerial photo from today.
- Landscape Scale Influences of Forest Area and Housing Density on House Loss in the 2009 Victorian Bushfires – a new paper in PLoS One on the latest research out of the Black Saturday bushfires suggesting that for vegetation management to be effective in reducing house loss in extreme fires it may need to penetrate bushland up to 1km from houses.
- The war that isn’t going to happen – A review of a new book (Cyber War will Not Take Place by Thomas Rid) on what it claims is a vastly overhyped threat.
- The New Flood Insurance Disaster – Discusses the flaws of the US National Flood Insurance Program, the flaws of its current reforms and a possible pathway to a program that accommodates both financial sustainability and improved risk reduction.
Federal Election Disaster Policies: The Minor Parties
In the lead up to this year’s federal election I’m going to be detailing and analysing the disaster and emergency management policies of the two major parties and the minor parties:
(links will appear above as I write each page)
I’ll continue updating these pages as more is announced in the lead up to the election. I’m going to focus on actual announcements and content of policy documents. Speculation on possible post-election policies is probably futile given the general non-partisan nature of disaster management. This post will be on the minor parties, which have some fairly hefty disaster management policies.
The Greens
Disaster Mitigation
The Greens propose a massive expansion of the existing Natural Disaster Resilience Program, increasing the federal contribution to over $300 million per year. They also seek to change the cost sharing rules of the current program to allow the Commonwealth to contribute a greater proportion of the funding for projects. In return for this they propose that the Commonwealth should, through a National Resilience Advisor and National Resilience Advisory Group, have a greater role in the decision making on projects. They propose that most of the funding for this program would be raised from a $2 levy on thermal coal exports, an interesting hypothecation. This could backfire – by linking natural disaster action (which generally enjoys wide support) with climate change action (which doesn’t). The policy would also seek to continue the National Climate Change Adaptation Research Facility with $10 million per annum for 5 years. NCCARF has undertaken a lot of disaster research, but it’s unclear how its continuation would integrated with the recently established Bushfire and Natural Hazards CRC.
Democratic Labor Party
Bushfire Mitigation
The DLP has a bushfire mitigation policy, with most of its elements focused at a state level, and seeks to establish a nationwide bushfire mitigation plan modeled on Western Australia. It would be funded by both State and Federal Governments. There doesn’t seem to be much more information on it.
