Home » Articles posted by casuscalamitas
Author Archives: casuscalamitas

Bushfire costs will grow, but will insurance be able to keep up?

Image Credit: CSIRO
This article was originally published on my LinkedIn profile.
I’ve seen plenty of coverage of the recent Climate Council report on the likely increase in bushfire losses. But in reality these growing costs could be far higher and even more unequally distributed.
The figures for economic losses are based primarily around insured losses (which in economic terms aren’t really a loss, assuming that the bushfire risk has been priced correctly), and this assumes that in the future most properties will still be insured against bushfire. But the larger conflagrations brought on by climate change as well as the closer coupling of disaster events (the longer fire seasons will make it more likely that multiple large bushfire disasters happen in any one year) will increase the costs for insurers and make it more likely that any one bushfire season could bankrupt them. In theory, the larger the loss in the worst case scenario, the higher premiums need to be in order for insurance companies to remain solvent. In practice, insurance companies push up premiums after large disaster events, even for different hazards. Together these mean that as climate change increases bushfire risk, in particular the risk of catastrophic outcomes, insurers will charge ever higher premiums and some may withdraw from the market entirely. This will lead to far fewer people being covered when a bushfire disaster strikes, with the government and charities being left to pick up the slack.
Perhaps it’s time then that the Federal Government revisited the idea of a national disaster insurance scheme – to ensure that future generations can meet the costs of these disasters.
Nepal Earthquake – How to Help from Afar
Almost two years to the day after I left Nepal it has been struck by the devastating earthquake that I and so many of my colleagues there had feared. I’m filled with much sorrow by the reports and images that are coming out of Kathmandu and remote mountain areas struck by the quake. Many highly skilled and committed individuals and organisations, such as the National Society for Earthquake Technology, have been working hard for many years to prepare the country and its people for this earthquake and I’m sure that their efforts have saved and will continue to save lives as this disaster unfolds. The international response is also scaling up and I sincerely hope that lessons of the 2010 Haiti earthquake and other disasters have been learned by the international community as it rushes to provide aid. I have seen many on social media wondering how they can help from afar so I have put together this short guide on how to donate, volunteer online and some things to think about if you’re considering going to Nepal.
Follow
For comprehensive updates on the earthquake and the response check out the following websites:
- Reliefweb
- IRIN News
- The coverage of the BBC and The Guardian (which as of publication was continuing its rolling coverage) have also been excellent. Local english language news sites like eKantipur and the Nepali Times are posting infrequent updates.
Donate
Many aid organisations have set up international and national appeals. For ease and to eliminate any international transaction fees search for appeals made by organisations in your own country. Search Nepal earthquake appeal in your web search engine. Here are some international options:
- Paypal has launched a donation drive, where you can donate to a number of organisations and Paypal will not charge any processing fees.
- iTunes has also set up a donation page
- Access the appeal for your national Red Cross/Red Crescent society through this page.
As some of the largest organisations present in Nepal who specifically work in disaster response AND have an international network so you can donate in your own country I recommend the Red Cross/Red Crescent, UNICEF, Oxfam and Plan International. It is also possible to donate directly to the United Nations Central Emergency Response Fund, which is distributed through UN agencies. Some news and government organisations have been compiling lists of appeals. Here are some that I have come across, let me know if you’re aware of others:
Please send cash and not goods. It’s really important that relief goods are targeted at the needs of the affected people and culturally appropriate. An added factor in this disaster is that Kathmandu Airport is a critical supply bottleneck – every piece of cargo space is absolutely precious and needs to contain only the most urgent needs. Save your old clothes and tins of corned beef and send cash instead.
Be careful who you donate to, especially small NGOs who you hear about through social media. Nepal has more than 30,000 non-government organisations and while many of them do excellent work many others are thinly veiled money-making scams. I would also recommend avoiding those religious NGOs who mix proselytising with aid delivery – which is unlikely to be appreciated in a predominantly Hindu and Buddhist nation. Do your homework before you donate to an organisation you haven’t heard of before. Check out their rating on a website like Charity Navigator or do some research on the Center for International Disaster Information website. Funding needs are not only immediate but will run into the months and years ahead as the shift from response to recovery and reconstruction happens. Hold a fund-raiser in the weeks or months ahead and donate the funds to one of the many appeals.
Volunteer Online
Digital humanitarian volunteering is growing in importance and beginning to be used more and more by humanitarian agencies on the ground in assessing needs and planning their response. Some organisations like the Standby Taskforce have a small cadre of more permanent volunteers (which you can join for future operations) but there are other efforts that almost anyone can contribute to:
MicroMappers – Classifying tweets and images
Humanitarian OpenStreetMap – Producing and updating digital maps
DigitalGlobe Tomnod – Identifying damage on satellite images
Follow Patrick Meier, who is very across digital humanitarianism, for updates on other opportunities.
Volunteer on Social Media
Sharing information on social media about where to donate, how to volunteer online and initiatives for locating missing people (such as Google Person Finder, ICRC’s Family Links and hotline phone numbers for foreign affairs departments and embassies) can help. Dispelling rumours, for example about aftershocks, is also very important particularly if you know people in the region. Unfortunately the disaster has brought many disturbed individuals out of the woodwork on social media who are posting disgustingly offensive things about the disaster that do not bear repeating. Don’t engage with these sick individuals. Downvote, report and block them instead.
Reconsider Unskilled Volunteering
I understand that many people want to rush in themselves to do what they can. However, for most this may not be a great idea. The majority of the international teams heading to Nepal are made up of specialist rescue workers, disaster medicine experts, logistics and resource management experts, specialists in disaster needs and recovery assessment etc. to bolster local experts and help get resources to Nepalese workers and volunteers on the ground. International rescue teams are required to be self-sufficient, which is very important given the shortages of basic supplies like food and water that are already occurring. The Nepalese Red Cross and other local NGOs have been working for years to train people in basic rescue, preparedness and first aid. With neighbours already helping neighbours there is no need for unskilled foreigners to take up precious supplies by coming to help. You can do much more good by donating the money you would spend on an airfare. One of the key lessons of the international response to the Haiti earthquake was the difficulty in coordinating the large number of small and inexperienced international NGOs and individuals who rushed to help – this actually hampered response efforts. It’s a similar story for further down the line once we get to recovery and re-construction efforts. If you don’t have specialist skills, your volunteering may end up taking away jobs that could be given to local people in the reconstruction. Despite the best of intentions, irresponsible volontourism can wind up not doing much good and even doing harm. Think critically about what it is you want to do before you go and check out the following resources to work out whether you’re doing the right thing.
Help the Economy Recover
If on the other hand your thinking of holidaying in Nepal – don’t necessarily change your plans. Tourism is a big part of Nepal’s economy and the industry and people’s livelihoods will be hit hard as tourists stay away in the wake of the earthquake. Once basic infrastructure has been repaired and flows of supplies have returned to normal, by all means make your holiday in Nepal and spend money in local shops, restaurants and other businesses and buy local products. This will help restore livelihoods and speed economic recovery.
Consider Skilled Volunteering
If you do have relevant skills, for example in engineering, volunteering in development can be an excellent way to help in the long term – especially if you’re aiming for fair trade learning. Check out organisations like Doctors Without Borders, Engineers Without Borders, EU Aid Volunteers, Australian Volunteers for International Development, VSO, Architects Without Borders or enquire with your national aid giving organisation about volunteer opportunities.
City of Sydney joins 100 Resilient Cities Campaign

Today the Rockefeller Foundation announced its latest group in the 100 Resilient Cities program. I was surprised to find Sydney as one of the cities who are now part of the program.
Except it’s not Sydney it’s the City of Sydney, one of the 40 or so local governments that make up the real Sydney metro area. Depending on how you want to measure resilience it’s probably one of the more resilient, if not the most resilient LGA in the Sydney Metro area. And with the possible exception of terrorism it would be on the lower side in terms of hazard profile too.
It contains 4% of the population and just 0.2% of the land area in the metropolitan region. It does however account for 28% of the Gross Regional Product, 25% of the jobs and 13% of the businesses of the Sydney metro area. However this economic contribution is heavily dependent on the rest of the metro area. Extreme interconnectedness is one of the things that reduces resilience and improved collaboration is one of the best ways to build it.
If City of Sydney is really serious about being a resilient city it will need to engage heavily with a much broader set of partners including the State Government and the other 40-odd local governments in the metro area. It will also need to ensure that the benefits it gains from being part of the Rockefeller collaboration are shared amongst these partners.
There is currently no city-wide emergency management or resilience forum in Sydney. Perhaps this grant will be the impetus that establishes one.
Highly fragmented local government is not unusual according to data from the OECD, with the average across 275 metro areas being 74 local governments (and that’s not even counting other levels or single purpose local governments). A number of other cities in the 100 resilient cities campaign have similar problems of fragmentation, and it’s not clear whether its something that’s even being considered.
It’s going to be interesting to see how the City of Sydney handles this issue moving forward with the program (and for that matter who gets the Chief Resilience Officer job). I’ll be staying tuned.
There are no Black Swans

One of the things that irritate me most about the Black Swan discussion is the number of people, workshops, media articles etc. that talk about trying to find them.*
A Black Swan is by definition something you did not expect to occur. It’s something you’re not prepared for (specifically), something that took you by surprise. Once you’ve forecast an event (or at least entertained its possibility) it ceases to be a Black Swan.
But are Black Swans really a complete surprise?
Someone, somewhere may have thought of the possibility of any event. When you think about it, all events are really Gray Swans or Gray Geese (I like the alliteration better). Indeed the events usually trotted out as Black Swans (9/11, the GFC, the Tohoku earthquake and Fukushima disaster) had been entertained as possibilities by smart people working in relevant fields. Indeed proposals had been made for various actions that would have prevented or substantially mitigated these disasters. But the decision makers, the people who really count, did nothing. They either weren’t told about the risk or chose to do nothing.
However, just because these events can be foreseen doesn’t mean we need to be expending enormous effort in searching for them.
One of the problems with the ‘hunting black swans’ mentality is that there are a near infinite number of possible events, of which only a much smaller subset will actually occur in a reasonable planning horizon. Trying to address every Gray Goose you can think of will quickly get you nowhere. What’s needed are actions that will enable organisations and communities to adapt to any event – this is what much of the resilience discussion is getting at.
Yet some of the risks we face are worth addressing on their own, either because they’re very likely or easy to mitigate – the ‘low hanging fruit’ of the risk management world. We shouldn’t ignore these in our quest for resilience, yet these ‘easy’ risks are sometimes forgotten about in the resilience discussion.
The risk landscape is not static either. Some risks that were Gray Geese may become easier to mitigate or likely enough that they warrant individual attention. Others may diminish in likelihood or become harder to mitigate individually and so are better off treated as part of broader resilience processes.
That might be harder than running workshops around finding black swans, but it will be much more useful.
*I’m sure it probably irritates N.N. Taleb even more.
Sex, Death and Hurricanes
By now you will have probably seen the reports about new research apparently showing that female named Atlantic Hurricanes are deadlier than male named storms because female names are ‘less scary’ than male names. The main investigation consisted of an analysis of 92 Hurricanes between 1950 and 2012 that made landfall in the USA (Katrina and Audrey, the two most deadly storms were excluded) examining fatalities, normalised damage, category, minimum pressure, gender of the storm name and year of occurrence.
There has been a fair amount of criticism on the paper from around the web including GRRLScientist in the Guardian, Future Tense in Slate, Not Exactly Rocket Science in National Geographic and on Mashable. The authors have responded to some of the criticism in these pieces.
The authors have also made their data and statistics from the model fit available for use.
The principal criticism has been on the approach to show that their finding is ‘significant’ which involves generalised linear regression on a negative binomial distribution and two-way interaction terms. Less fancy methods (simple correlation and a multi-linear regression) found no significant effect. B
Is there a difference in the number of people who die in Hurricanes based on the storm name’s gender?
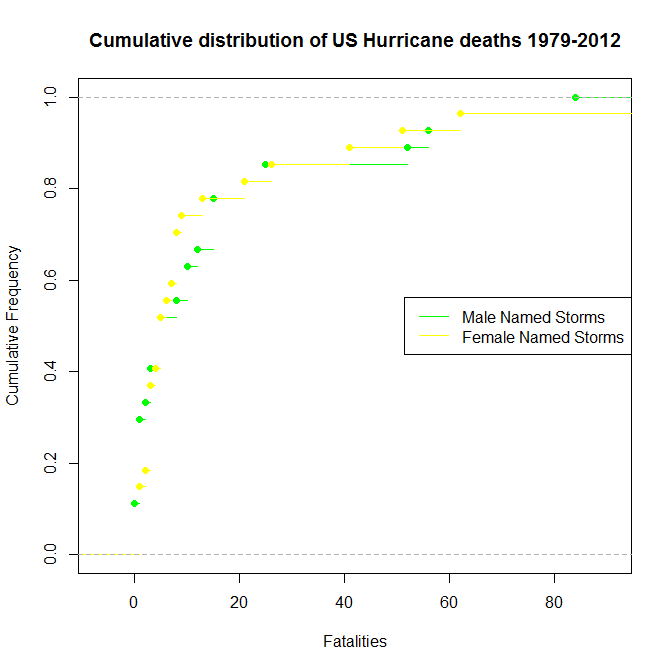
You can’t just compare the average rates – Hurricane fatalities are a fat tail phenomenon, a small number of big storms contribute most of fatalities. Let’s forget modelling, regression algorithms and the fancier statistics. Let’s just look at the data. Below I’ve plotted the cumulative distributions of fatalities from male named storms and female named storms from the entire dataset.
 You can see that for the high frequency, low fatality events the distributions are basically the same but there appears to be some divergence at the more severe end with a higher fatality rate in female named storms. But the difference isn’t that much – and there’s the data issue, with storms between 1953 and 1979 only receiving female names there’s way more of them than male named storms. So visually there’s not a huge difference and we can quantify this using a statistical measure called the Two-sample Kolmogorov-Smirnov test. This test allows comparisons of two samples of data and helps you decide between one of two hypotheses:
H0 – They’re from the same distribution.
H1 – They’re from different distributions.
For these data the KS-test gives D = 0.1065, p-value = 0.976. This means that we can’t reject H0 – i.e. we can’t tell if the two samples are different or there’s no detectable difference in the underlying pattern of fatalities based on storm name gender.
We can also look at only the storms during the time in which both male and female names were used:
 Here we can see that what little difference we saw in the complete dataset disappears completely, further suggesting that the effect found by Jung et. al. is quite probably a statistical fluke. If you look at enough variables you’ll eventually find a statistically significant correlation. In fact if you look hard enough you can find all sorts of strange things that correlate with each other.
To explain the effect, the authors turn to additional experiments where they measured a difference based on storm name gender in perceived threat and willingness to evacuate. Implicit sexism plays a big, big role in our society. (I highly recommend Cordelia Fine’s book, Delusions of Gender, which goes into the detail very well) but it’s hardly the only thing at play – many factors cause people to (usually) downplay threats from and delay responses to Hurricanes and other disasters.
The scenarios presented (you can see examples here) were not anything like real Hurricane warnings and media broadcasts, which tend to be much more alarming and action oriented, especially for more severe Hurricanes which is where the authors claim there is an effect. A better experiment would be to mock up a TV news broadcast of Hurricane Alexander/Alexandria and show it to people in hurricane prone areas and see what the results are. I would be very surprised if there was still a detectable storm name effect once a heavy dose of reality is injected.
As for policy recommendations I think its definitely too soon to consider changing the naming system, but whilst we’re talking about communication the NHC could really overhaul it’s woeful public advisory messages.
Alternatively there’s always this idea:
Australian Federal Budget: Bad News for Disasters
Well the Abbot Government’s first budget and it ain’t pretty. Here’s a roundup of all the new measures and cuts related to disasters. Although there’s a few new measures (such as the back-to-the-future National Bushfire Mitigation Programme) most of the ‘new’ spending are really the continuation of programs from previous governments.
New and continued spending
- Stronger biosecurity and quarantine arrangements – $20 million over 4 years
- Up to $320 million in assistance for drought affected farmers. However most of this is in the form of concessional loans or is contingent on state co-payments. Much of this spending is largely consistent with that of previous governments.
- National Bushfire Mitigation Programme – $15 million over 3 years
- Expanding research at the Australian Institute of Tropical Health and Medicine – $42 million over 4 years, though it’s unclear whether this will be offset by cuts elsewhere in the Australian Research Council’s budget.
- $9 million over three years for the continuation of the National Climate Change Adaptation Research Facility (though this is a drop in the amount of funding compared to previous governments).
- Addressing insurance costs in North Queensland. $12.5 million in grants to bodies corporate to undertake engineering assessments of strata properties to understand natural disaster risks and identify mitigation measures. This initiative will also establish an insurance comparison website for home building and contents and strata insurance for North Queensland.
- Continue the Natural Disaster Resilience Program and the National Partnership on pest and disease preparedness and response programmes (although with reduced funding)
Cuts
- Closure of the Australian Emergency Management Institute. Some of its programs will be transitioned to a ‘virtual’ institute.
- Cuts of $7.6 billion to foreign aid over 5 years
- Cut the Exotic Disease Preparedness Program
- Merger of a number of biosecurity committees and working groups
- Cuts of $10 million over 4 years to the Bureau of Meteorology
- Cuts of $21.7 million over 4 years by merging the National Environmental Research Programme and the Australian Climate Change Science Programme
- Cease the National Insurance Affordability Initiative which had a number of activities related to flood risk management at a saving of $72.2 million
I’ve sourced these all from the budget papers. Let me know in the comments if I’ve missed anything.
My Post on the EM Knowledge Hub Blog
My Post on the EM Knowledge Hub Blog
I’ve written a post for the EM Knowledge Hub Blog on Disaster Risk Financing for governments. Check it out.
Big Cost Needs a Big Risk Assessment
Between 2000 and 2009 natural disasters cost the federal government about $1.5 billion. Then in the following 3 years they cost $7.7 billion, $1.6 billion and $2.1 billion respectively. That’s right, in each of the last 3 years disasters have cost more than in the previous ten years combined.
This huge increase has not gone unnoticed, the federal government will initiate a Productivity Commission inquiry into national disaster funding arrangements later this year.
The inquiry will undoubtedly consider where governments are spending on disasters, but will it look at where that money is coming from?
Although state and local governments do insure some of their assets the predominant approach to funding disaster losses in Australia has been to rely on the federal government’s ability to borrow money at rock-bottom rates. This is clearly not sustainable in the long term.
There are a range of ways governments can deal with disaster costs and their variability, from public disaster funds to catastrophe linked securities. These methods can also make the cost of disasters something that’s up-front and thus give governments strong incentive to invest in mitigation.
Up-front spending requires knowledge of how much the government will need to pay in the long term. All existing estimates for annual disaster losses in Australia are based on statistics of past events. Leaving aside the future influence of climate change and demographic growth these figures are heavily flawed. Simple approaches based on historical statistics just don’t work. Disaster losses follow a power law and statistical predictions will always underestimate the probabilities of large losses.
Fortunately there is another way – a comprehensive, bottom-up National Disaster Risk Assessment.
This process would bring together the massive amounts of existing data and modelling expertise on disaster risk in Australia, identify and address gaps and refine tools to improve risk assessment. The results would enable the estimation of not only the annual costs of disasters, but also the cost of the worst disaster seasons.
Risk Assessment is more than just modelling. To get the best outcomes requires collaboration among stakeholders to share knowledge, experience and ideas for reducing disaster risk. Governments, NGOs, academia, businesses and communities all have unique abilities to reduce disaster risks and the risk modelling activities should meet their needs.
It’s in actually contributing to risk reduction that a National Disaster Risk Assessment could really see gains. Since the 2002 COAG inquiry into Natural Disasters in Australia there have been more than 160 government inquiries into disasters, producing a wish-list of close to 4000 recommendations. Though the National Strategy for Disaster Resilience has brought together key strategic priorities, the level of its implementation is unclear.
Coming out of the twin strands of data-driven risk modelling and stakeholder-driven risk assessment a more focussed approach to resilience could be taken: A 3-year National Plan with a small number of concrete, achievable priorities and clear deadlines for implementation. As these priorities are completed new ones can be added through the risk assessment process, ensuring that the National Disaster Risk Assessment is an ongoing project rather than something done once and then shelved.
A National Disaster Risk Assessment would need a custodian to ensure this continuity and ensure national risk assessment becomes a long-term activity of government. The Productivity Commission, with its modelling and consultative expertise and long history of influence of national policy could be one potential option. Or perhaps the creation of a new agency, say a National Disaster Risk Commission, could better meet this task.
Regardless, making decisions about funding future disaster losses without even really knowing what they could be is a risky game.
Natural Disasters vs. Man-made Disasters – A Better Taxonomy?
We’re always bombarded with news about natural disasters, acts of god and stories of the wrath of mother nature. It’s a recurring meme in the public discussion about disasters and even amongst disaster management experts.
But we know that so called “natural disasters” aren’t really natural – disasters are a social phenomenon – they need something to impact on before . Even talking about natural and anthropogenic hazards doesn’t really work very well. Human practices around land-clearing and vegetation management have a significant influence on floods and bushfires. Landslides that impact on human development are very often due to modifications made to slopes. And before we started building fragile structures earthquakes would have been a curiosity like solar eclipses. Then there’s climate change – we’re beginning to drive change in the natural processes that govern many hazards.
Is there a better way for talking about hazards and disasters that goes beyond this false dichotomy?
One concept that I’ve been introduced to recently is the idea of policy domains and policy communities. A policy community is the group of all the participants in the policy making and implementation process for a particular subject. Some players are only concerned with one policy area (such as engineering seismologists) whilst others are concerned with many policy areas (such as meteorologists or disaster recovery experts).
To see how this concept could be used in categorising hazards I used Gephi to build a map of various hazards and how their policy communities are connected. For example blizzards and heatwaves are connected because they both relate to meteorology and climate – there’s overlap in their policy community. An engineer may work in both the earthquake policy community, the dam failure policy community and the structural collapse policy community and so on. This is a very subjective process, without data on how experts in various fields are connected (using say LinkedIn), this is really just built on what I think. But let’s see if we can pull some groups of hazards out of this map:

Click for a larger version.
Based on the connections between the different policy communities I’ve pulled out three separate broad policy domains:
Settlements – this comprises most of the traditional natural hazards policy domain, but adds in a few other engineering related hazards such as structural collapse (which has huge overlaps with policy domains like earthquake) and dam failure (which could almost be considered a sub-speciality of the flood policy domain). The drivers and mitigation options for these hazards relate to where and how we build our houses, neighbourhoods and cities.
Society – this comprises human health, human security and agricultural hazards. This is a pretty diverse set of hazards (as evidenced by their sparse connections) but they mostly relate to people and societies. It could be broken up a bit further, but for simplicity I’ve grouped them.
Economy – this group has industrial/technological accidents, transport accidents and utilities failures, there’s pretty big overlap with terrorism (which I placed in the societal group) and a number of the Settlements policy domains. Most of these hazards relate to economic activity in the modern age and comprise most of the traditional anthropogenic hazards policy domain. I think that labelling this group Economy is instructive as it reminds us that the so-called ‘human-caused’ disasters aren’t caused by people per se, but the productive activities we do and the materials and technologies used in them. It’s this group of hazards that have evolved the fastest and continue to evolve rapidly.
So let’s forget natural hazards and anthropogenic hazards – how about Settlement hazards, Societal hazards and Economic hazards?
Do we really need double the firefighters?
The reborn Climate Council has recently put out a new report on the projected impact of climate change on bushfires. Most of the content is backed up by sound research and pretty decent science, but some of the media coverage is focussing on a supposed doubling in the need for fire-fighters by 2030.
I’ve long been wary of claims that climate change requires massive investment in the emergency services – the problem of increasing bushfire or flood risks are better dealt with using disaster mitigation measures like land-use planning, building controls
Let’s unpack this claim a bit. The executive summary of the Climate Council report says it as thus:
By 2030, it has been estimated that the number of professional firefighters will need to approximately double (compared to 2010) to keep pace with increased population, asset value, and fire danger weather.
This was sourced from a 2013 report titled Firefighters and climate change: The human resources dimension of adapting to climate change prepared by the National Institute for Economic and Industry Research for the United Firefighters Union (I’m going to leave aside the obvious question of bias here and stick to the content).
It focusses on full-time firefighters of which there are about 11,500 in Australia in addition to the FTE of 1700 part-time firefighters and 220,000 volunteer firefighters. It’s these 11,500* who are counted as professional firefighters in the report.
I’m going to focus on the projections for NSW for time constraints.
In its future projection of fire-fighting resource requirement the NIEIR report examines two drivers:
- Population and asset growth
- Increased response due to climate change
First, population and asset growth. Here’s the projections of firefighter numbers that the report says would be required to maintain existing levels of firefighter cover of population and assets in NSW.
| 2010 | 2015 | 2020 | 2025 | 2030 | |
| NSW Firefighter projections(NIEIR) | 3604 | 3999 | 4424 | 4706 | 4991 |
This is an annual growth rate of 2.1-2.2% to 2020 and 1.2-1.3% between 2020 and 2030.
But the population of NSW is not growing this fast. Over the next 20 years the ABS estimates that population growth will average somewhere between 0.9% and 1.3%. So that leaves the rest of the projected growth due to increases in asset value. But does asset value make sense as a basis for estimating fire cover?
Not really – assets are property and a property will increase in value over time (due to inflation, rising replacement costs, increasing land value etc.) even though the property itself (and thus the number of firefighters needed to put it out if it’s on fire) remains unchanged. Population growth should be able to account for the increasing physical units of stuff (houses, businesses, vehicles etc.) that firefighters provide protection to. Maybe, though there’s other drivers?
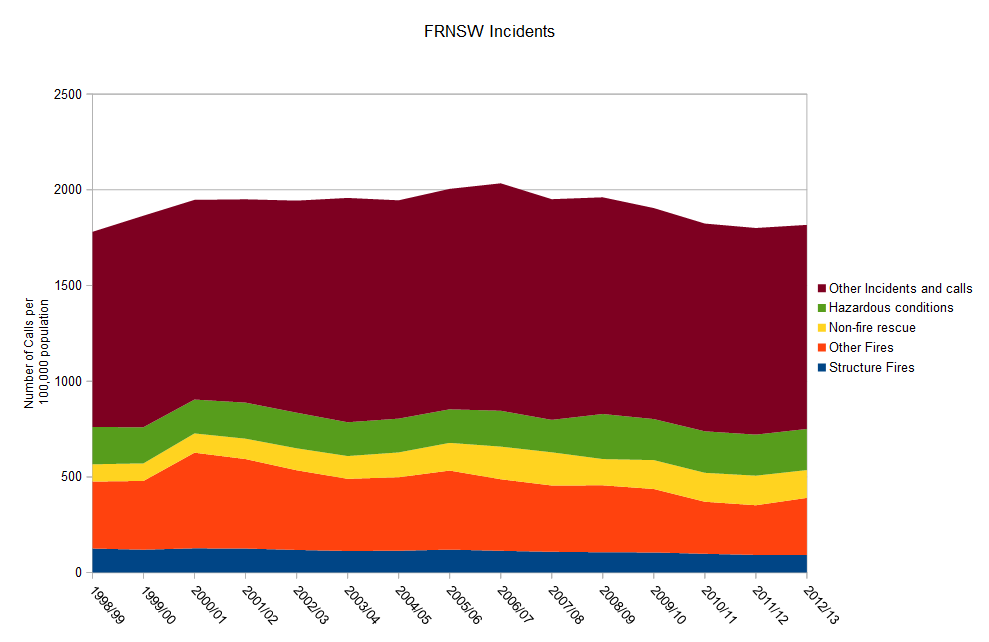
So let’s look at responses by Fire and Rescue NSW over the last 15 years. The following chart shows their activities per 100,000 of population (culled from their annual reports)
Click to engraphenate
The first thing we notice is that fires make up a relatively small proportion of the overall activity of Fire and Rescue NSW (and this is similar to other urban fire organisations across the country). The second thing we note is that the total number of incidents as a proportion of population is unchanged over the last 15 years. That is – population alone can explain any increase in the activity of Fire and Rescue NSW.
One thing that might be harder to see on the graph is that the number of fire incidents is actually going down. This is particularly the case with structure fires which have decreased by 32% over the last 15 years, per 100,000 population. Other fires have also dropped, by 42% – though the reduction in fire response has been offset by increases in non-fire rescue (57%) and Hazmat incidents** (20%). The increase in non-fire rescues is likely due to expansion in the land rescue areas that FRNSW is responsible for.
The decline in structure fires makes sense – we’re building safer buildings (code compliant, better electricals, fire safety measures etc.) and we’re also behaving safer (mostly because fewer people are smoking in bed). Landscape fires (bush and grass fires) make up about a third of the ‘Other Fires’ category, but I don’t have enough data to break this category down across a decent time series to identify any trends.
The Total Incidents tells the story though – there’s no basis for assessing growth in overall demand of full-time firefighters on anything but population. So on the basis of population growth the resource requirements for FRNSW full-time firefighters looks something like this:
| 2010 | 2015 | 2020 | 2025 | 2030 | |
| NSW Firefighter projections(population based) | 3516*** | 3572 | 3807 | 4042 | 4230 |
This produces a much more sensible growth rate.
Now let’s turn to climate change. Again here are the NIEIR projections for NSW, this time with added rows for a Low (H2) and High(H3) climate change scenario.
| 2010 | 2015 | 2020 | 2025 | 2030 | |
| NSW NIEIR | 3604 | 3999 | 4424 | 4706 | 4991 |
| H2 NIEIR | 4741 | 5728 | |||
| H3 NIEIR | 5175 | 6759 |
The NIEIR methodology hinges on a correlation they found between the number of Landscape fires in Victoria as set out in the 2012 Report on Government Services and the number of total fire ban days (both partial and statewide) declared in Victoria in any one fire season as enumerated in the CFA Annual Reports. By my count that’s a measly 5 data points.
Here’s the plot of the number of total fire ban days versus the number of landscape fires in Victoria.
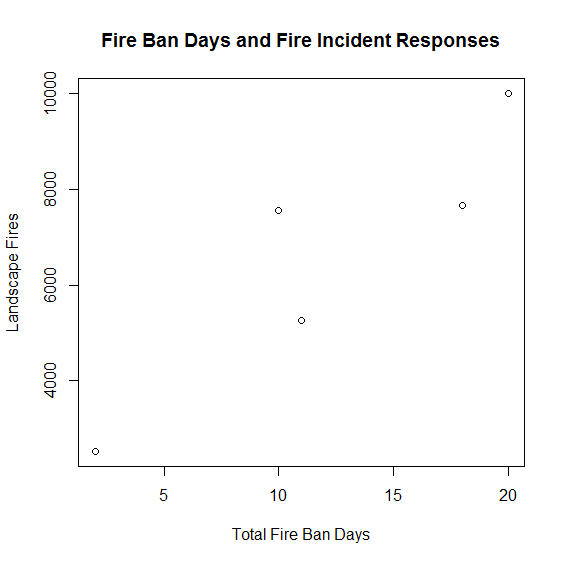
There’s a reasonably strong positive relationship there (correlation coefficient ~0.9) – but it’s only 5 data points. NIEIR could really have done better than that. The response could be substantially more noisy than appears or even non-linear. They’ve also assumed that this relationship would hold everywhere.
NIEIR then uses an excellent report prepared in 2007 by the Bushfire CRC, CSIRO and the BoM for the Climate Institute which examined, amongst other things the expected change in days with FFDI>50 (on which Total Fire Bans are generally declared) under a variety of climate change scenarios.
Now here the outline of the methodology begins to get a bit shaky. They seem to have applied some sort of modifier to take into account fewer bushfires in urban and arid areas (which is sensible) and matched similar sites in western and northern Australia with those in the Lucas paper (which is not sensible – the climate regimes are unlikely to change in similar ways) to produce area estimates of the increase in firefighters due to both climate change and population/asset growth.
Now here comes the kicker – best as I can figure out (by reverse engineering the math) NIEIR has assumed that the increase would apply to all incident types responded to by professional fire fighters, not just the landscape fires that make up about 5-10% of all incidents responded to by full-time firefighters. Even a doubling in the number of Extreme fire danger days, which is likely in some but not all areas, would only increase the overall taskload of NSW full-time firefighters by 4-6%. This is actually within the annual variation in incident numbers in NSW, suggesting that on this crude measure it would be possible for additional response to climate change to be handled within population adjusted resourcing.
On the other hand the resource requirements of the volunteer fire services (where a much larger propotion of the taskload is made up of bushfires) could be more severely impacted. Unfortunately I don’t think that these type of analyses really provide much information for emergency managers to plan future resource requirements in response to climate change. The impact of climate change on emergency services will be most keenly felt in extreme events – where you’re more interested in surge capacity and where part-time firefighters and volunteers play a much larger role. A scenario approach to modelling resource requirements during these extremes would provide much more insight into what we really do need for the greater amount of extreme weather in the future.
In the meantime it sadly seems that the Climate Council lacks the resources to adequately check its sources, especially when they come from the gray literature. Here’s hoping that they can encourage some work to get the real answers on human resource requirements for extreme fires under climate change.
* The report also discusses some of the problems in counting how many full-time firefighters there are in Australia, it uses a figure of 12,041 which is calculated from Census responses. I’ve taken the figure from the Productivity Commission’s Report on Government Services – so this is an approximate figure.
** I’m not very confident about this figure – FRNSW have changed their way of categorising hazmat incidents over the years, so a small change here may have been offset by a small change in one of the other incident categories – probably other. I’ve applied all the usual statistical tests and these changes are significant – just as there is no significant change to the Other incidents category or the Total incidents overall.
*** Here I’ve used the number of full-time firefighters contained in the FRNSW Annual Report.
