Home » Disaster Research
Category Archives: Disaster Research
Sex, Death and Hurricanes
By now you will have probably seen the reports about new research apparently showing that female named Atlantic Hurricanes are deadlier than male named storms because female names are ‘less scary’ than male names. The main investigation consisted of an analysis of 92 Hurricanes between 1950 and 2012 that made landfall in the USA (Katrina and Audrey, the two most deadly storms were excluded) examining fatalities, normalised damage, category, minimum pressure, gender of the storm name and year of occurrence.
There has been a fair amount of criticism on the paper from around the web including GRRLScientist in the Guardian, Future Tense in Slate, Not Exactly Rocket Science in National Geographic and on Mashable. The authors have responded to some of the criticism in these pieces.
The authors have also made their data and statistics from the model fit available for use.
The principal criticism has been on the approach to show that their finding is ‘significant’ which involves generalised linear regression on a negative binomial distribution and two-way interaction terms. Less fancy methods (simple correlation and a multi-linear regression) found no significant effect. B
Is there a difference in the number of people who die in Hurricanes based on the storm name’s gender?
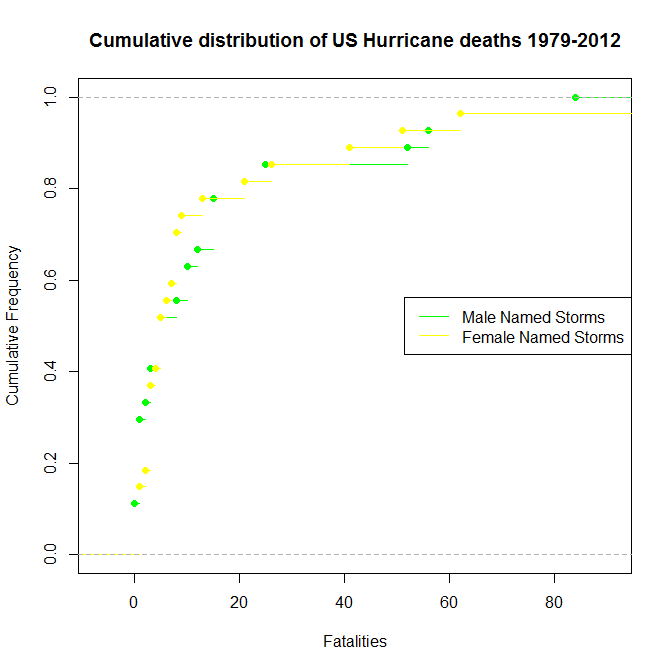
You can’t just compare the average rates – Hurricane fatalities are a fat tail phenomenon, a small number of big storms contribute most of fatalities. Let’s forget modelling, regression algorithms and the fancier statistics. Let’s just look at the data. Below I’ve plotted the cumulative distributions of fatalities from male named storms and female named storms from the entire dataset.
 You can see that for the high frequency, low fatality events the distributions are basically the same but there appears to be some divergence at the more severe end with a higher fatality rate in female named storms. But the difference isn’t that much – and there’s the data issue, with storms between 1953 and 1979 only receiving female names there’s way more of them than male named storms. So visually there’s not a huge difference and we can quantify this using a statistical measure called the Two-sample Kolmogorov-Smirnov test. This test allows comparisons of two samples of data and helps you decide between one of two hypotheses:
H0 – They’re from the same distribution.
H1 – They’re from different distributions.
For these data the KS-test gives D = 0.1065, p-value = 0.976. This means that we can’t reject H0 – i.e. we can’t tell if the two samples are different or there’s no detectable difference in the underlying pattern of fatalities based on storm name gender.
We can also look at only the storms during the time in which both male and female names were used:
 Here we can see that what little difference we saw in the complete dataset disappears completely, further suggesting that the effect found by Jung et. al. is quite probably a statistical fluke. If you look at enough variables you’ll eventually find a statistically significant correlation. In fact if you look hard enough you can find all sorts of strange things that correlate with each other.
To explain the effect, the authors turn to additional experiments where they measured a difference based on storm name gender in perceived threat and willingness to evacuate. Implicit sexism plays a big, big role in our society. (I highly recommend Cordelia Fine’s book, Delusions of Gender, which goes into the detail very well) but it’s hardly the only thing at play – many factors cause people to (usually) downplay threats from and delay responses to Hurricanes and other disasters.
The scenarios presented (you can see examples here) were not anything like real Hurricane warnings and media broadcasts, which tend to be much more alarming and action oriented, especially for more severe Hurricanes which is where the authors claim there is an effect. A better experiment would be to mock up a TV news broadcast of Hurricane Alexander/Alexandria and show it to people in hurricane prone areas and see what the results are. I would be very surprised if there was still a detectable storm name effect once a heavy dose of reality is injected.
As for policy recommendations I think its definitely too soon to consider changing the naming system, but whilst we’re talking about communication the NHC could really overhaul it’s woeful public advisory messages.
Alternatively there’s always this idea:
Do we really need double the firefighters?
The reborn Climate Council has recently put out a new report on the projected impact of climate change on bushfires. Most of the content is backed up by sound research and pretty decent science, but some of the media coverage is focussing on a supposed doubling in the need for fire-fighters by 2030.
I’ve long been wary of claims that climate change requires massive investment in the emergency services – the problem of increasing bushfire or flood risks are better dealt with using disaster mitigation measures like land-use planning, building controls
Let’s unpack this claim a bit. The executive summary of the Climate Council report says it as thus:
By 2030, it has been estimated that the number of professional firefighters will need to approximately double (compared to 2010) to keep pace with increased population, asset value, and fire danger weather.
This was sourced from a 2013 report titled Firefighters and climate change: The human resources dimension of adapting to climate change prepared by the National Institute for Economic and Industry Research for the United Firefighters Union (I’m going to leave aside the obvious question of bias here and stick to the content).
It focusses on full-time firefighters of which there are about 11,500 in Australia in addition to the FTE of 1700 part-time firefighters and 220,000 volunteer firefighters. It’s these 11,500* who are counted as professional firefighters in the report.
I’m going to focus on the projections for NSW for time constraints.
In its future projection of fire-fighting resource requirement the NIEIR report examines two drivers:
- Population and asset growth
- Increased response due to climate change
First, population and asset growth. Here’s the projections of firefighter numbers that the report says would be required to maintain existing levels of firefighter cover of population and assets in NSW.
| 2010 | 2015 | 2020 | 2025 | 2030 | |
| NSW Firefighter projections(NIEIR) | 3604 | 3999 | 4424 | 4706 | 4991 |
This is an annual growth rate of 2.1-2.2% to 2020 and 1.2-1.3% between 2020 and 2030.
But the population of NSW is not growing this fast. Over the next 20 years the ABS estimates that population growth will average somewhere between 0.9% and 1.3%. So that leaves the rest of the projected growth due to increases in asset value. But does asset value make sense as a basis for estimating fire cover?
Not really – assets are property and a property will increase in value over time (due to inflation, rising replacement costs, increasing land value etc.) even though the property itself (and thus the number of firefighters needed to put it out if it’s on fire) remains unchanged. Population growth should be able to account for the increasing physical units of stuff (houses, businesses, vehicles etc.) that firefighters provide protection to. Maybe, though there’s other drivers?
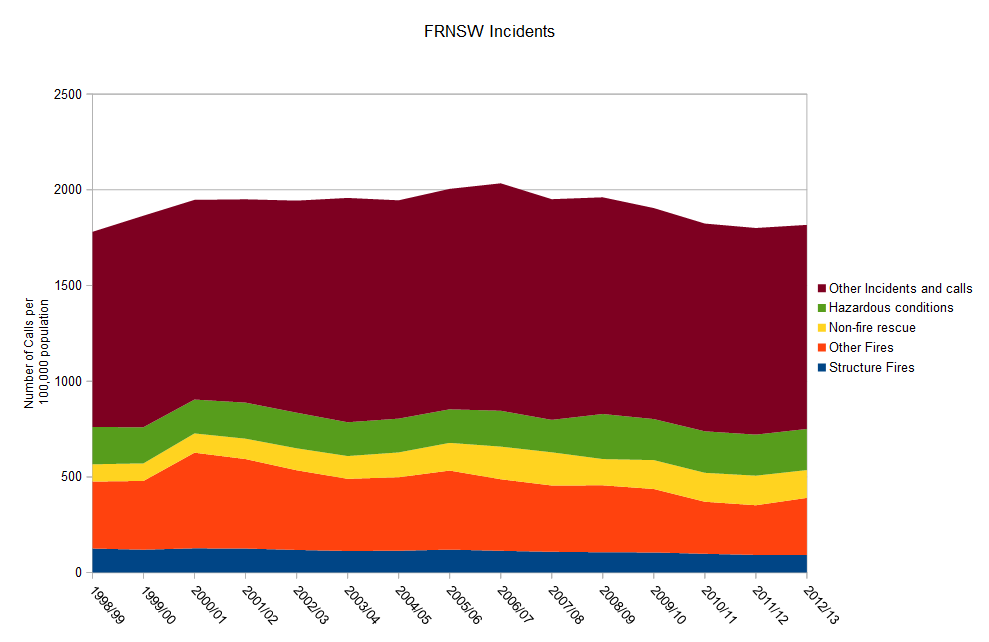
So let’s look at responses by Fire and Rescue NSW over the last 15 years. The following chart shows their activities per 100,000 of population (culled from their annual reports)
Click to engraphenate
The first thing we notice is that fires make up a relatively small proportion of the overall activity of Fire and Rescue NSW (and this is similar to other urban fire organisations across the country). The second thing we note is that the total number of incidents as a proportion of population is unchanged over the last 15 years. That is – population alone can explain any increase in the activity of Fire and Rescue NSW.
One thing that might be harder to see on the graph is that the number of fire incidents is actually going down. This is particularly the case with structure fires which have decreased by 32% over the last 15 years, per 100,000 population. Other fires have also dropped, by 42% – though the reduction in fire response has been offset by increases in non-fire rescue (57%) and Hazmat incidents** (20%). The increase in non-fire rescues is likely due to expansion in the land rescue areas that FRNSW is responsible for.
The decline in structure fires makes sense – we’re building safer buildings (code compliant, better electricals, fire safety measures etc.) and we’re also behaving safer (mostly because fewer people are smoking in bed). Landscape fires (bush and grass fires) make up about a third of the ‘Other Fires’ category, but I don’t have enough data to break this category down across a decent time series to identify any trends.
The Total Incidents tells the story though – there’s no basis for assessing growth in overall demand of full-time firefighters on anything but population. So on the basis of population growth the resource requirements for FRNSW full-time firefighters looks something like this:
| 2010 | 2015 | 2020 | 2025 | 2030 | |
| NSW Firefighter projections(population based) | 3516*** | 3572 | 3807 | 4042 | 4230 |
This produces a much more sensible growth rate.
Now let’s turn to climate change. Again here are the NIEIR projections for NSW, this time with added rows for a Low (H2) and High(H3) climate change scenario.
| 2010 | 2015 | 2020 | 2025 | 2030 | |
| NSW NIEIR | 3604 | 3999 | 4424 | 4706 | 4991 |
| H2 NIEIR | 4741 | 5728 | |||
| H3 NIEIR | 5175 | 6759 |
The NIEIR methodology hinges on a correlation they found between the number of Landscape fires in Victoria as set out in the 2012 Report on Government Services and the number of total fire ban days (both partial and statewide) declared in Victoria in any one fire season as enumerated in the CFA Annual Reports. By my count that’s a measly 5 data points.
Here’s the plot of the number of total fire ban days versus the number of landscape fires in Victoria.
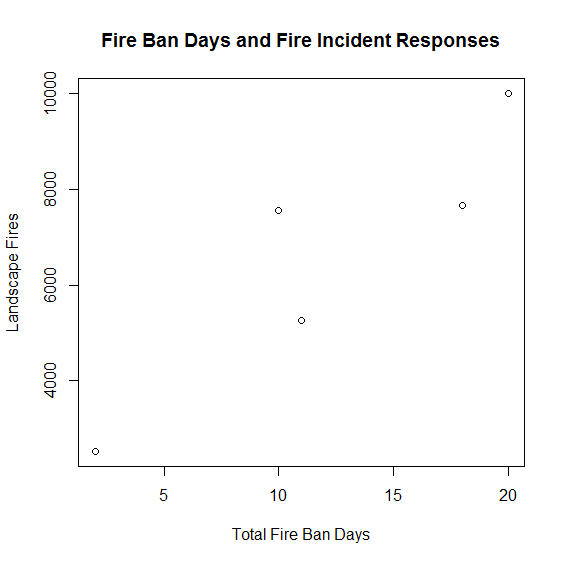
There’s a reasonably strong positive relationship there (correlation coefficient ~0.9) – but it’s only 5 data points. NIEIR could really have done better than that. The response could be substantially more noisy than appears or even non-linear. They’ve also assumed that this relationship would hold everywhere.
NIEIR then uses an excellent report prepared in 2007 by the Bushfire CRC, CSIRO and the BoM for the Climate Institute which examined, amongst other things the expected change in days with FFDI>50 (on which Total Fire Bans are generally declared) under a variety of climate change scenarios.
Now here the outline of the methodology begins to get a bit shaky. They seem to have applied some sort of modifier to take into account fewer bushfires in urban and arid areas (which is sensible) and matched similar sites in western and northern Australia with those in the Lucas paper (which is not sensible – the climate regimes are unlikely to change in similar ways) to produce area estimates of the increase in firefighters due to both climate change and population/asset growth.
Now here comes the kicker – best as I can figure out (by reverse engineering the math) NIEIR has assumed that the increase would apply to all incident types responded to by professional fire fighters, not just the landscape fires that make up about 5-10% of all incidents responded to by full-time firefighters. Even a doubling in the number of Extreme fire danger days, which is likely in some but not all areas, would only increase the overall taskload of NSW full-time firefighters by 4-6%. This is actually within the annual variation in incident numbers in NSW, suggesting that on this crude measure it would be possible for additional response to climate change to be handled within population adjusted resourcing.
On the other hand the resource requirements of the volunteer fire services (where a much larger propotion of the taskload is made up of bushfires) could be more severely impacted. Unfortunately I don’t think that these type of analyses really provide much information for emergency managers to plan future resource requirements in response to climate change. The impact of climate change on emergency services will be most keenly felt in extreme events – where you’re more interested in surge capacity and where part-time firefighters and volunteers play a much larger role. A scenario approach to modelling resource requirements during these extremes would provide much more insight into what we really do need for the greater amount of extreme weather in the future.
In the meantime it sadly seems that the Climate Council lacks the resources to adequately check its sources, especially when they come from the gray literature. Here’s hoping that they can encourage some work to get the real answers on human resource requirements for extreme fires under climate change.
* The report also discusses some of the problems in counting how many full-time firefighters there are in Australia, it uses a figure of 12,041 which is calculated from Census responses. I’ve taken the figure from the Productivity Commission’s Report on Government Services – so this is an approximate figure.
** I’m not very confident about this figure – FRNSW have changed their way of categorising hazmat incidents over the years, so a small change here may have been offset by a small change in one of the other incident categories – probably other. I’ve applied all the usual statistical tests and these changes are significant – just as there is no significant change to the Other incidents category or the Total incidents overall.
*** Here I’ve used the number of full-time firefighters contained in the FRNSW Annual Report.
Risky Links: Global Disaster Reports
In all my courses here in Pavia we’ve been getting into the alphabet soup of international disaster management. One thing that’s got me a little confused are all the international reports on disasters. So I’ve compiled a list of all the regular reports brought out in the international space on disasters and data and trends in their impact and response. One thing about most of these reports (particularly for a data geek like me) is that they’re underpinned by massive amounts of data on disasters, their impact and response – including time series.
Global Assessment of Risk – This report is published by the United Nations Office for Disaster Risk Reduction (UNISDR) every two years.
World Disasters Report – Published annually by the International Federation of Red Cross and Red Cresent Societies (IFRC).
World Risk Report – Published annually by the Institute for Environment and Human Security at the United Nations University (UNU-EHS)
Global Risks – Published annually by the World Economic Forum (WEF).
Annual Disaster Statistical Review – Published by the Centre for Research on the Epidemiology of Disasters (CRED), this data in this annual report is used in many other international reporting.
Sigma Natural Catastrophes and Man-Made Disasters – Swiss Re publishes this report annually as a special issue of it’s Sigma magazine.
Global Humanitarian Assistance Report – Published annually by Development Initiatives.
Humanitarian Accountability Report – Published annually by the Humanitarian Accountability Project
A Review of Natural Disasters – Published annually by the Brookings Institute
Etymology of Disasters
One of my favourite pastimes is getting hung up over terminology used in disaster management – different jargon means different things in different places. This can be problematic. For example I recall one instance where some relative newcomers to emergency management in Australia were promoting the establishment of Local Resilience Forums in Australia. Thing is that Australia already has them – for example in NSW they’re called Local Emergency Management Committees and in Queensland Local Disaster Management Groups. Even simple words like risk and resilience can mean different things to different professionals – and that’s without even taking into account community understanding of various words.
I thought it might be interesting to look at where some of the common words we use come from so I did some poking around on an online etymology dictionary and here’s what I found:
| accident | Used in English from the late 1300s it is from 1100s old French from the Latin accidentem/accidere “to happen or fall out” from ad– and cadere “fall”. |
| alarm | First in use from early 1300s from old French alarme, from the Italian all’arme “to arms!” |
| alert | Used since the 1590s from the French alerte from the Italian all’erta “to the height” from erta “lookout, high tower” past participle of ergere “raise up” from the Latin erigere “raise”. |
| catastrophe | Although in use in English since the 1530s it originally meant a “reversal of what is expected” acquiring its present meaning around 1748. The word is from the Latin catastropha from the Greek katastrophe, from katastrephein literally meaning a down-turn. |
| command | In use since around 1400 from old French comand/comander from the vulgar Latin commandare from Latin commendare “to recommend, entrust to” |
| control | The present use as “to direct or dominate” is from the mid 1400s. From early 1300s “to check or regulate” from the Anglo-French contreroller “exert authority” from the medieval Latin contrarotulus “a counter or register” from Latin contra– (meaning against) and rotulus (meaning wheel). |
| coordination | Circa 1600 meaning “orderly combination” from the French coordination from late Latin coordinationem from Latin coordinare “to arrange or set in order” from com– (meaning “together”) and ordinatio “arrangement” from ordo “order”. Present meaning of “harmonious action” used since 1855. |
| disaster | From the 1590s derived from middle French désastre which is from the Italian disastro meaning “ill-starred”. |
| emergency | First used around the 1630s it is derived from the Latin emergens, present participle of emergere meaning “to rise up or bring forth”. |
| hazard | First used around 1300 (though the modern meaning only evolved around the 1540s) from the 12th century old French hazard which may be from the Spanish azar “an unfortunate card or throw at dice”. The Spanish word is possibly from the Arabic words az-zahr “the die” or yasara “he played dice”. |
| mitigation | From mid 1300s from the Latin mitigationem/mitigare “soften, make tender” from mitis “gentle, soft” and agere “do or make”. |
| peril | First used in English around 1200 it comes from the 10th century French word peril from the Latin periculum meaning “an attempt, trial, experiment; risk, danger” which comes from the Greek peria “trial, attempt, experience” |
| rescue | Used since around 1300 from the old French rescorre ”protect or keep safe” from re– and escourre “to cast off” which is from the Latin excutere “to shake off”. |
| resilience | Used since the 1620s it’s from the Latin resiliens/resilire meaning “to rebound/recoil” which is a combination or re– and salire “to jump/leap” (and interestingly where the word salient comes from). |
| risk | First recorded in English in 1728 it entered into usage in the 1660s from the French word risque which itself comes from the Italian risco (which is now rischio) from riscare meaning “run into danger”. |
| vulnerability | Vulnerable was first used around 1600 from the late Latin vulnerabilis which means “wounding”. |
| warning | Since the late 1300s from old French monition from Latin monitionem “warning or admonition” from monere “to warn”. |
Factcheck: More properties inundated in 2011 floods?
It’s been an oft repeated statement that more properties were flooded in the 2011 Brisbane floods than in 1974 despite the flood peak being a metre lower. As part of something I’m working on I decided to look further into it.
Disasters in Australia – not a new normal, just normal
The recent spate of large natural disasters in Australia has a lot of people asking whether we are in some sort of “new normal” of regular catastrophic disasters. I believe such comments demonstrate a lack of sense of history – disasters, even catastrophic disasters, are a regular feature of the Australian landscape. Disasters ARE normal, there’s nothing new about it.
I thought I’d take a look at another 10 year period to demonstrate; I’ve picked the 1930s. Here’s a brief summary of significant disasters in that decade:
- 1930 – Widespread flooding in Queensland – 6 deaths
- 1932 – Bushfire in Gippsland – 9 deaths
- 1934 – Cyclone in North Queensland – 99 deaths
- 1934 – Flooding in Melbourne and Victoria – 35 deaths and 400 homes destroyed
- 1935 – Cyclone in Broome WA – 141 deaths and pearling fleet destroyed
- 1938/39 – Heatwave, 438 deaths, and the Black Friday bushfires with 71 deaths in Victoria, 6 in NSW and 1000 homes destroyed.
- 1939/40 – Heatwave 112 deaths
- 1940 – Burdekin Flood, Queensland – 3 deaths
Sources: Wikipedia and EM Knowledge Hub
IDRC Davos 2012: Post Conference Reflections
During the final week of August 2012 I had the opportunity to attend and volunteer at the 4th International Disaster and Risk Conference in Davos, Switzerland. This report summarises the conference and my experiences there. At the end of the report are links to the conference program, papers and presentations which I would encourage the reader to peruse.
IDRC Davos 2012
Tomorrow I’m off to the International Disaster Risk Conference 2012 in Davos, Switzerland.
I’ll be volunteering there and checking out as much of the latest research and best practice in disaster risk management as I can. It’s particularly encouraging to see sessions on cascading mega disasters, urban risks, the future of risk management and broader governance approaches in a post-Hyogo Framework for Action environment.
I hope to post a couple of updates during the conference and a longer recap on my return to Kathmandu. In the meantime check out the conference website or follow them on twitter.
Evidence based disaster management and the Triangle of Life
One of the big drawcards for me to disaster management is that it is such an interdisciplinary career. It brings together expertise in economics, geography, psychology, sociology, geophysics, meteorology, climate science, technology, business management, information technology, public policy, statistics, anthropology, gender and sexuality studies, culture and ethnography, engineering, environmental science, health, education, agriculture and more.
In a field that draws on so many areas of knowledge, research is critically important. This includes research that may not immediately be identified to have an emergency management impact.
As emergency management has so much knowledge to draw on I often ask myself why there isn’t a stronger engagement between practitioners and researchers in the field.
Conferences seem to be dominated by consultants and professional speakers (often those leaders who presided over emergency management disasters). Governments and NGOs in these times of austerity are cutting budgets and emergency management organisations aren’t immune. In any budget cuts, research is often the first to go.
Part of the problem is that large parts of academia, including many emergency management trade journals are walled off behind expensive paywalls. This problem is particularly acute for those working in developing countries who don’t have alternative means of access to this knowledge. Subsidised journals like the Australian Journal of Emergency Management are extremely important, as they enable any emergency manager to access high quality research and researchers to reach a broad emergency management audience.
Yet few publications see emergency management practitioners and researchers collaborating on papers, or indeed researching areas of interest to local practitioners.
The problem extends beyond that though. Emergency management lacks the culture of critical thinking common to the sciences. This tends to lead to an over-reliance on good ideas, historical practice and ‘common-sense’ which may in reality turn out to be ineffective or worse, actually harmful.
The Triangle of Life: Where’s the evidence?
In a place like Kathmandu earthquakes are never too far away as a discussion topic. In a couple of different conversations the ‘triangle of life’ idea has come up. This concept basically states that you should seek shelter next to heavy objects in an earthquake, as this will be where the survival spots are if the building collapses. I always thought that the concept had some utility in developing countries, without the enforcement of building codes in places like the US and Japan.
The concept first surfaced in an email chain letter (and continues to do the rounds, with elements of it popping up in this recent youtube video) authored by self-proclaimed rescue expert Doug Copp. The triangle of life idea has been thoroughly refuted by every government emergency management agency and experienced NGO I’ve been able to find. Some of the advice in the email is consistent with that of most earthquake preparedness experts, however most of it and especially the triangle of life are absolute nonsense. The credibility of the author is also highly questionable.
But what does the evidence say?
The Triangle of Life has an intrinsic appeal to some urban search and rescue practitioners who focus on rescuing people from collapsed structures. (On the other hand plenty have put together excellent rebuttals). However the people that these professionals rescue are not typical survivors. Most will either not be trapped or be rescued by other survivors using hands and basic tools.
By the time heavy Urban Search and Rescue teams arrive on the scene very few survivors will be found. Those that are found by these rescuers will be in voids within the collapsed structures – aka triangles of life.
This produces a sampling bias, the people in these voids are not representative of the total population of survivors.
The only experimental evidence for triangle of life came from an exercise in Turkey, which Copp was involved with (Unfortunately the links to all the primary source material on this exercise are broken). Dummies were placed within a structure, which was then collapsed. They found that the dummies placed in ‘duck, cover, hold’ positions were crushed and those placed in ‘triangle of life’ positions were not. Now by collapsed I mean demolished with conventional demolition techniques. Unfortunately this does not simulate how buildings fail in earthquakes, so little can be drawn from the results.
The other aspect of a controlled collapse is that the voids are much more predictable. Now I’m not suggesting that the ‘experimenters’ deliberately placed the dummies in these locations but subconsciously the experimenter effect could have come into play.
So the only piece of evidence for this advice is seriously flawed at best. The ‘triangle of life’ is already on shaky ground.
The other problem with this concept is that as an earthquake survival strategy the triangle of life will only protect you in the event of a building collapse. Odds are a total structural collapse will very likely ruin your day, despite what the theory claims. Any survival strategy will only increase your chances of survival, not guarantee it, in the event of a building collapse.
But what about if your building doesn’t collapse?
Most of the injuries (and some of the deaths) from an earthquake are caused by non-structural items such as bookcases, shelves, cabinets and the items on them. Many injuries are also caused by people fleeing (often without shoes) and cutting themselves on broken glass and other falling debris. This is precisely what the ‘duck, cover, hold’ strategy is aimed at avoiding.
For example in the 1994 Northridge Earthquake most fatalities were caused by building collapse, most injuries by falling over and being hit by falling objects. There were about 4 times more injuries than fatalities.
Researchers in Iran calculated that for a large earthquake there the number of people in areas exposed to falling debris (and not building collapse) would be 12,000 times the number of people exposed to building collapse. (Unfortunately this is the only scholarly article that I’ve found that directly compares ‘duck, cover, hold’ with ‘triangle of life’.)
So when the shaking starts, odds are that ‘duck, cover, hold’ will be the most appropriate strategy.
But what about community education? Could ‘triangle of life’ be explained too,allowing people to choose their own strategy?
Trying to communicate anything about earthquake preparedness is difficult enough. You could take a mixed strategy, that attempted to explain where the limited applicability of the triangle of life might be useful. However, this would only end up confusing most of the target audience, who may end up doing nothing or panicking. To reach the broadest audience any disaster preparedness message needs to be simple and the advice that will be applicable to the largest number of people is ‘duck, cover, hold’.
There’s no evidence to suggest that the triangle of life is any better than chance.
Which brings me back to my initial discussion:
Many career paths into disaster management don’t provide a strong background in research methods or critical thinking skills. When you combine this with the poor engagement between researchers and disaster managers and the difficulty in accessing scholarly publications its no wonder that rumours like the triangle of life to continue to circulate, even among disaster management professionals.
Research accessibility, critical thinking skills and cross sector engagement all need to be addressed to ensure disaster management is evidence based and thus successful.
