
After every emergency and whenever the media, and many emergency managers, are talking about emergency service response the claim of ’emergency services are under increasing demand’ is oft repeated. It’s very tempting to believe that there is an increasing demand on emergency services, with the increased resources that such a trend can bring, but what do the numbers say.
For this I turn to the Productivity Commission’s Report on Government Services, released in January of every year with reporting for the previous financial year, the latest was released in 2013. I’ll look at the variety of measures the report uses to assess operational response.
Bushfires
The ROGS provides information on the number of landscape fires with data collected from a range of sources, primarily the jurisdictional fire and land management agencies.
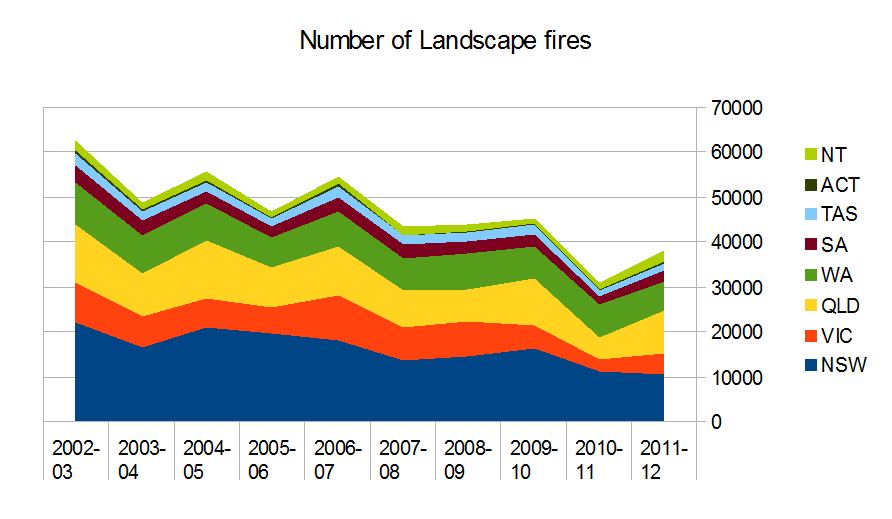
As you can see the number of fires have been trending down or stable in most jurisdictions and nationally in the last 10 years (although 2002-03 is almost certainly an outlier given the amount of fire activity in that year – however removing it still produces the same trend). The ROGS also gives the fires per person and per area (for jurisdictions) but the trends are the same so I won’t reproduce the charts here.
Floods and Storms
Unfortunately the ROGS doesn’t give data for total number of flood, storm and tempest incidents. The best we can do is with the number of responses by fire service organisations to these incidents.
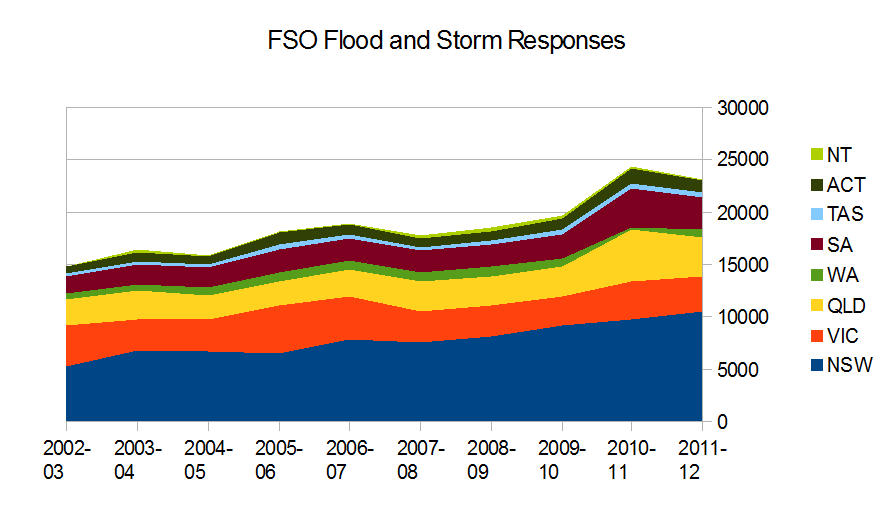
Here we can see that there is indeed an increase in responses by the fire service organisations to flood and storm events (particularly obvious in NSW). Now this chart doesn’t give the total number of events, or the responses of the state and territory emergency services, but it does demonstrate that fire services are becoming much more involved in flood and storm response. It doesn’t tell us why the FSOs are responding more to these events, but it may have something to do with the reduction in numbers of landscape fires.
Now the two charts aren’t exactly comparable so the following should be taken with a generous helping of salt but I’ve added the number of fires and the number of responses to flood, storm and tempest to get the following chart:
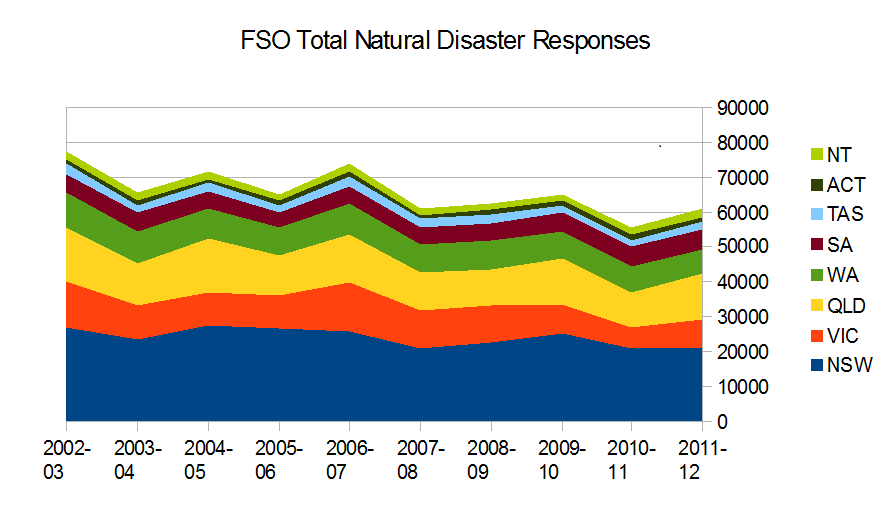
Here we see that the total ‘events’ still falls – so on these measures at least it would appear that the fire service organisations are not becoming significantly more busy, but the reality is not entirely clear. It would be good to see future editions of the ROGS include State and Territory Emergency Service responses.

